Economic and Market Review
June 30, 2024
| Equity Indices | YTD Return |
| Dow Jones | 4.17% |
| S&P500 | 15.98% |
| NASDAQ | 21.93% |
| MSCI – Europe | 8.78% |
| MSCI–Emerging | 3.41% |
| Bonds | |
| 2yr Treasury | 4.74% |
| 10yr Treasury | 4.43% |
| 10yr Municipal | 2.89% |
| U.S. Corporate | 5.54% |
| Commodities | |
| Gold | $2,329.30/oz |
| Silver | $29.56/oz |
| Crude Oil (WTI) | $82.92/bbl |
| Natural Gas | $2.45/MMBtu |
| Currencies | |
| CAD/USD | $0.73 |
| GBP/USD | $1.27 |
| USD/JPY | ¥161.46 |
| EUR/USD | $1.07 |
Overview
Equities moved higher still, with new all-time highs reached in late June. This has been led by the “Magnificent 7” and other large caps, which lead the 2024 market with a combined 15.3% YTD return, followed far behind by emerging market equities at 7.7% YTD return.
Increasingly mild economic data has bolstered the market’s gains as the Fed inches closer to it’s 2% inflation target. However, markets have adjusted expectations down to just one mild cut or two small interest rate cuts in 2024. We feel that a single cut is more likely. Fed Chair Jerome Powell’s comments continue to emphasize that the Fed is looking for stronger downward movement on inflation before any cuts occur – which is something it has not yet seen.
Continued inflation has sent gold up to new highs, with energy commodities also seeing higher prices with a hot summer driving global energy demand.
Late in June Treasuries prices fell once again, with the yield curve still inverted for the longest period since the early 80s. The 10-year treasury yield has bounced between 4.0% and 4.4% this year, with investors still waiting for a more affirmative stance from the Fed. According to a Bank of America survey, portfolio managers are the most underweight in bonds since November of 2022, with the bond market seeing the most selling activity since 2003. Overwhelmingly, portfolio managers bolstered their equity positions, with stocks seeing the highest portfolio concentration since January 2022.
New Home Sales Slump While Supply Is at 16 Year High
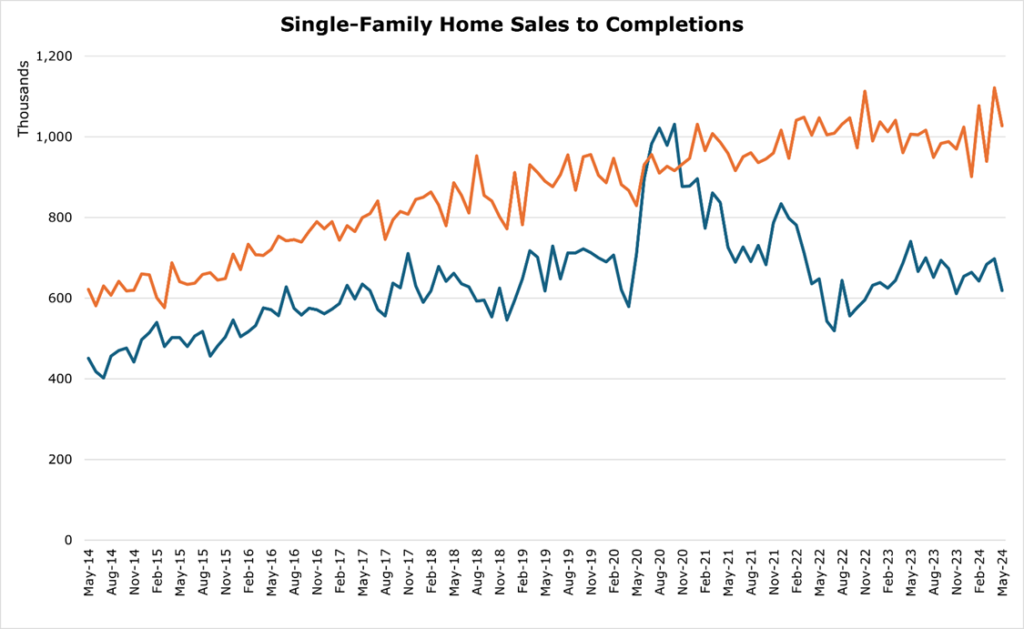
Sales of new single-family homes have fallen to a 6-month low, with an 11.3% year-over-year drop reported, bringing supply to a 16-year high. Mortgage rates fell below 7% for the first time since March, but remain at double the level they were in late 2021.
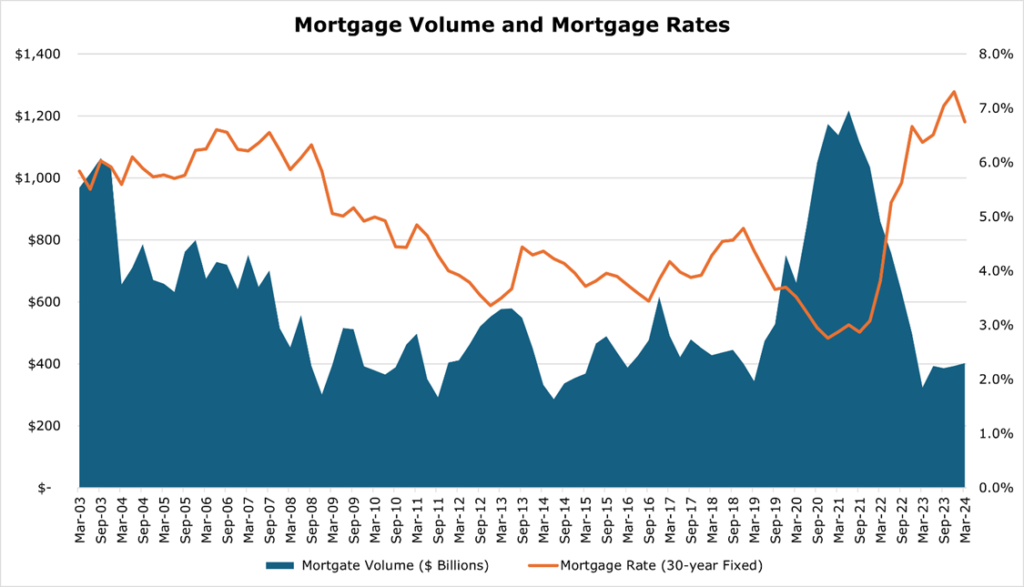
Mortgage rates are still the highest they have been since 2001, which has offset any affordability gains from an increased housing supply. Freddie Mac and Fannie Mae both expect interest rates to stay above 6.5% for the remainder of the year, with rates only beginning to dip in mid-2025.
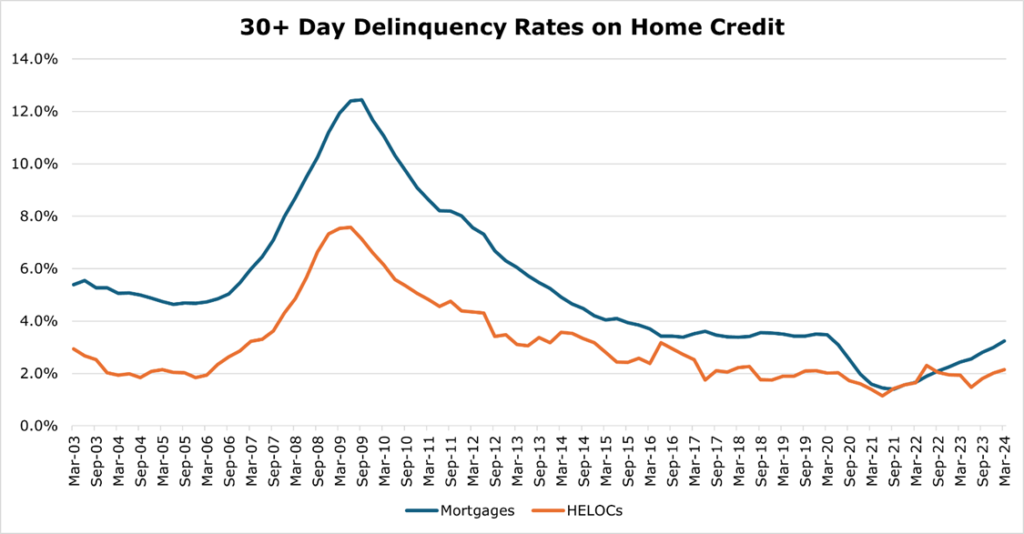
Delinquency rates have not yet moved above the long-term trend in housing debt, though they are likely to reach that level by the end of the year.
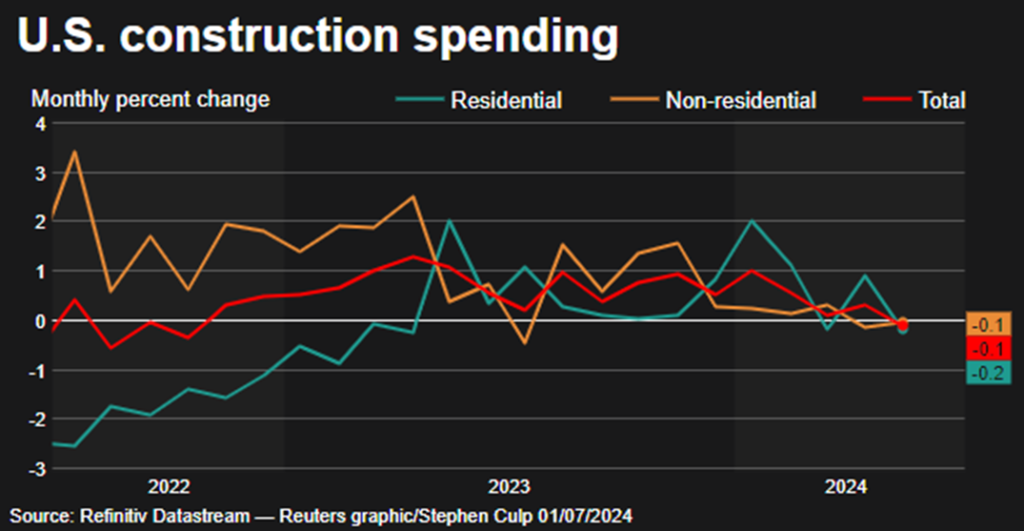
Construction spending in residential has met non-residential spending, with overall construction spending reaching its lowest level since 2022. As mortgage rates have increased, slack has developed in the housing market as inventories have begun to grow faster than sales, which may put downward pressure on residential investment. In our view, we are likely to see contraction in investment in residential construction in the second half of 2024 as mortgage rates stay elevated.
Where Are We in the Fight Against Inflation?
The Fed has continued to signal it will bide its time until a more sustained disinflation occurs. At a recent meeting Powell continued to state that there is movement in the right direction, but the Fed was still waiting for more “sustainable” downward movement.
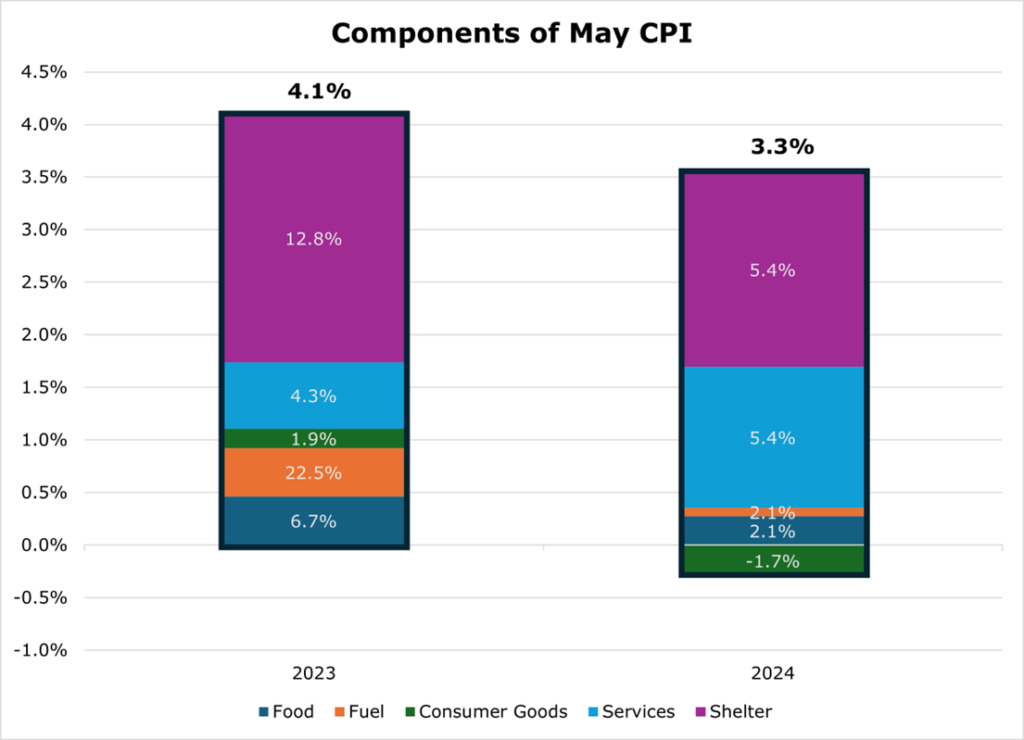
Inflation has certainly been impacted by the Fed’s contractionary monetary policy, though it does remain elevated above the 2% target. Significant forward progress remains to be seen in shelter and services components while food and fuel have returned to their long-term averages. Consumers may see some relief, as deflation in consumer goods has been seen.
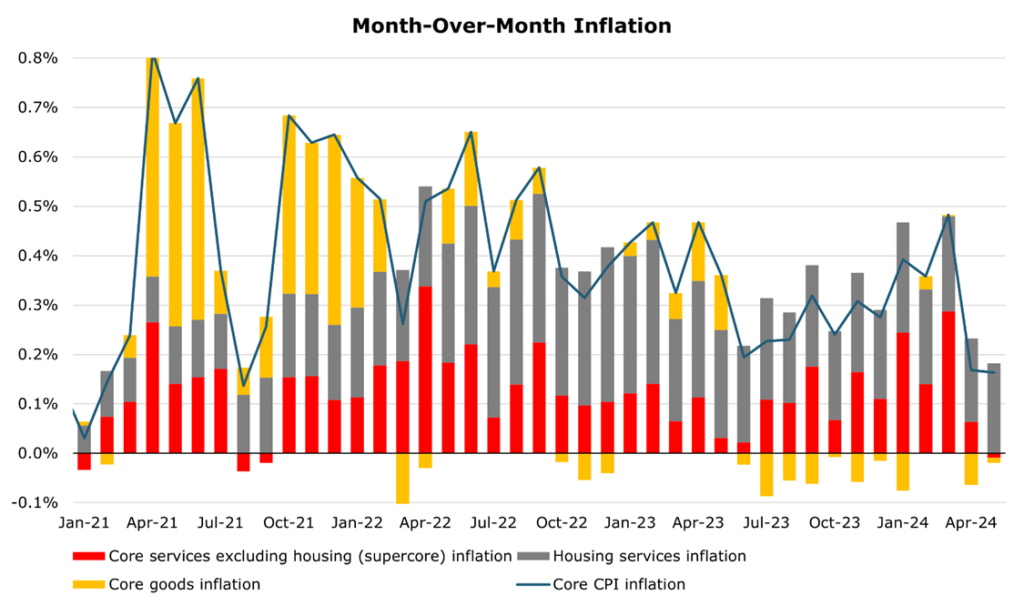
Housing inflation remains the hottest item in the CPI, consistently remaining elevated even as other forms of inflation have begun to see a longer-term slowdown. While mortgage rates stay elevated through the end of 2024, the increase in real incomes driven by the hot labor market will continue to put upward pressure on prices over the medium term.
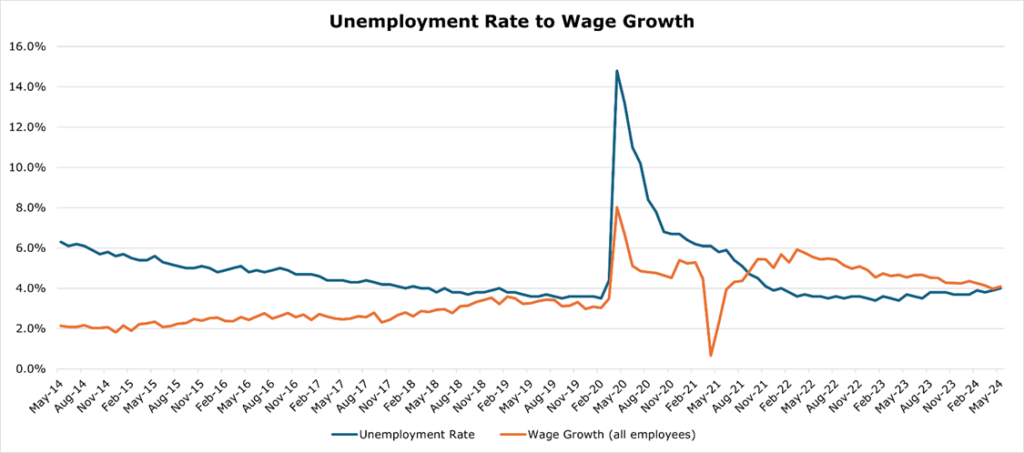
here are signs of a slowing labor market, with unemployment claims reaching their highest level in 2 years, hitting 4.0% unemployment. However, wages increases have continued far above their long-term trend, at 4.1% year over year. Job openings continued to stay hot with 1.22 vacancies for every unemployed person, though this is a minor contraction from 1.24 last month.
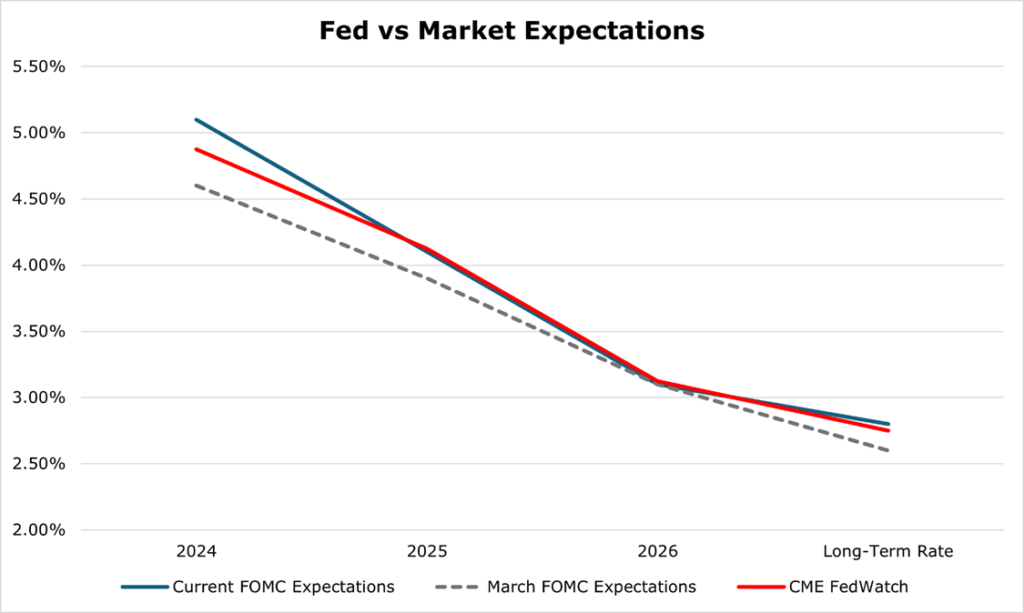
he Fed’s FOMC (Federal Open Market Committee) expect 2024 to end with interest rates sitting at 5.1%. Compared to the previous Fed meeting, rate expectations have seen a sharp jump up, leaving little doubt that even the Fed sees inflation as a longer-term problem.
Markets were slightly more optimistic in the shorter term, with a median projected rate of 4.9% at the end of 2024. We believe that the Fed will only cut a single time by the end of the year. Over the long term, the FOMC and the market both move in lockstep down to a long-term interest rate of 2.75% by 2027. The Federal Deficit spinning out of control makes these forecasts unlikely in our opinion. Deficit Spending is inflationary and will keep inflation and thus interest rates higher for longer. We expect the market to be negatively surprised by the lack of further progress on inflation and thus how high interest rates stay.
Magnificent 7 Continues to Pose Concentration Risk
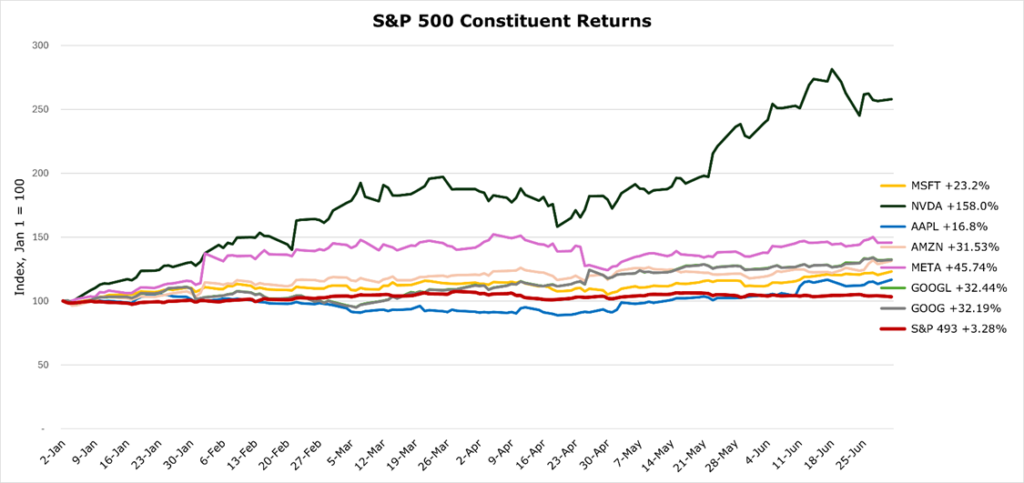
Concentration in the S&P 500 has hit a new record high, with 31.1% of the index now concentrated in the “Magnificent 7” – a group of 7 mega cap tech stocks. Just a decade ago, the top 10 stocks made up just 14% of the index.
Collectively, the Magnificent 7 are up 33% over the last year, compared to just 3.3% of the S&P equal weight index – colloquially known as the “S&P 493”. This staggeringly represents 61% of returns originating from just the top 7 mega cap tech stocks.
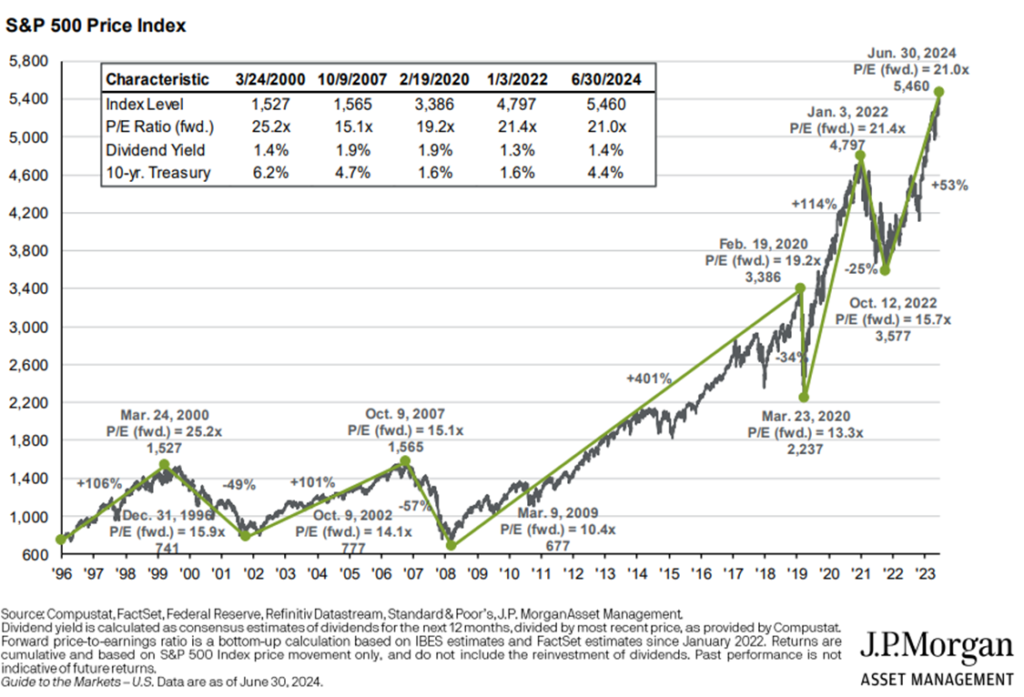
The high concentration has also increased the forward P/E ratio to the second highest level since the dot com bubble, and far above the 30-year average of 16.7x. The top 10 holdings have a current P/E of 30.3x, compared to a long-term average of 20.4x.
Summer Energy Prices Indicate Positive Expectations
Oil prices gained around 13.8% since last month, on an increase in expected demand over the summer months and that a prolonged conflict in the middle east could spark lower oil output. Energy prices were broadly higher, with record heat recorded across most of the world causing demand spikes on power grids.
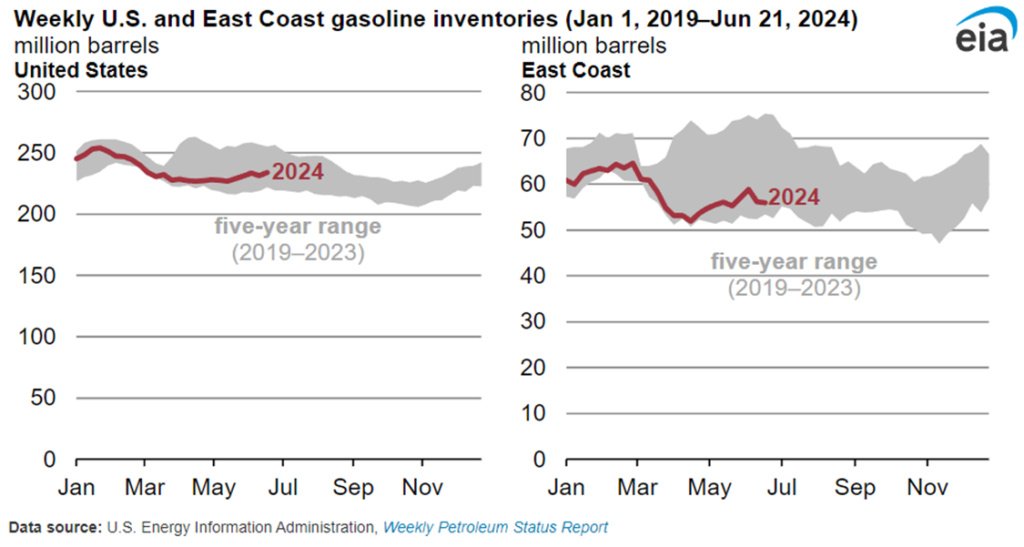
Total US gasoline storage remains on the lower end of the 5-year range, especially on the east coast, despite lower-than-expected fuel demand. Storage could be drawn down further as the summer travel season is expected to be the strongest since before COVID-19. Low refining margins due to higher oil prices may slow efforts to ramp up production if fuel demand recovers, leading to higher prices at the pump in gasoline importing regions like the East and West Coast regions.
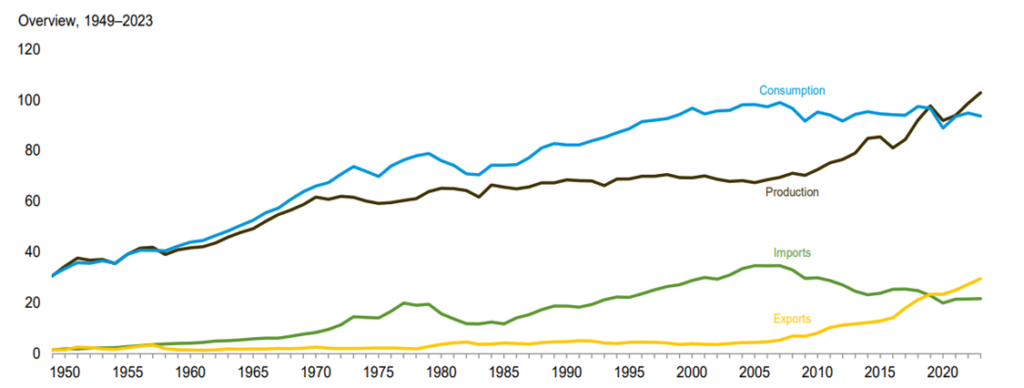
For the first time since the 1950s, US energy production exceeded consumption in 2023, from strong growth in natural gas output. The US has become a consistent net exporter of energy thanks to strong natural gas production growth and increased demand from Europe.
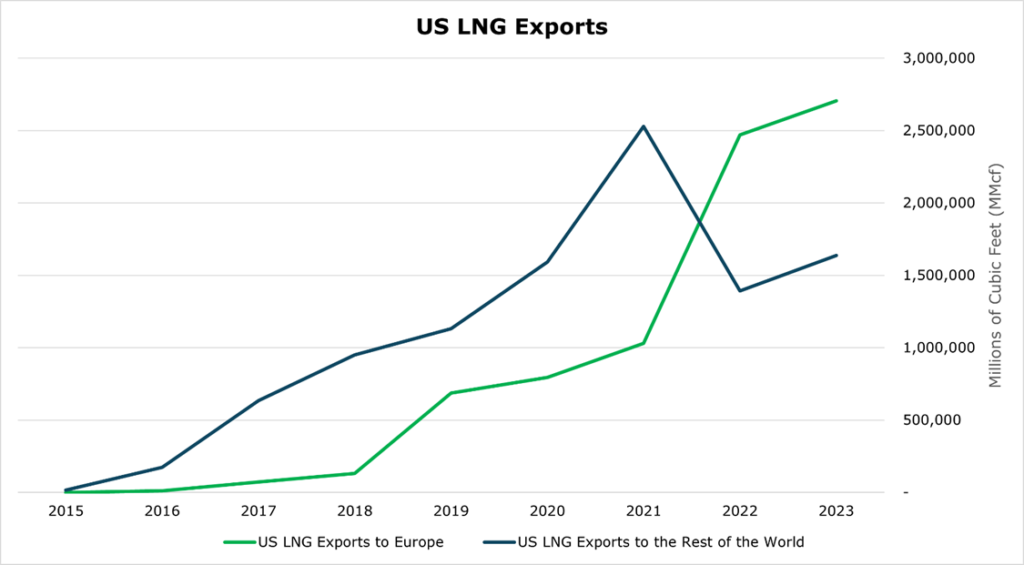
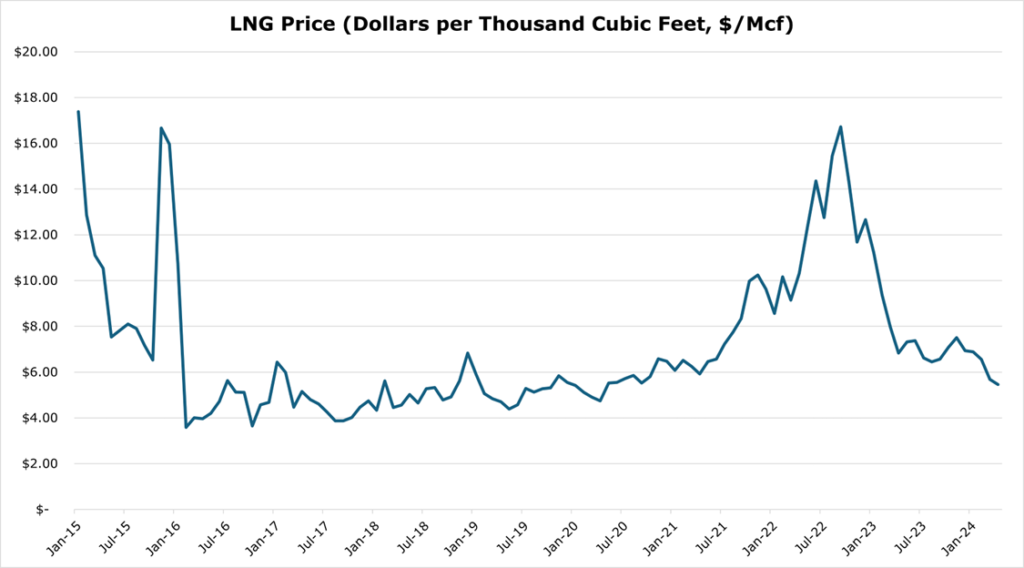
Additionally, continued weak demand recovery in Asia has stalled LNG price realizations with prices being their lowest since 2019.
The State of the Consumer
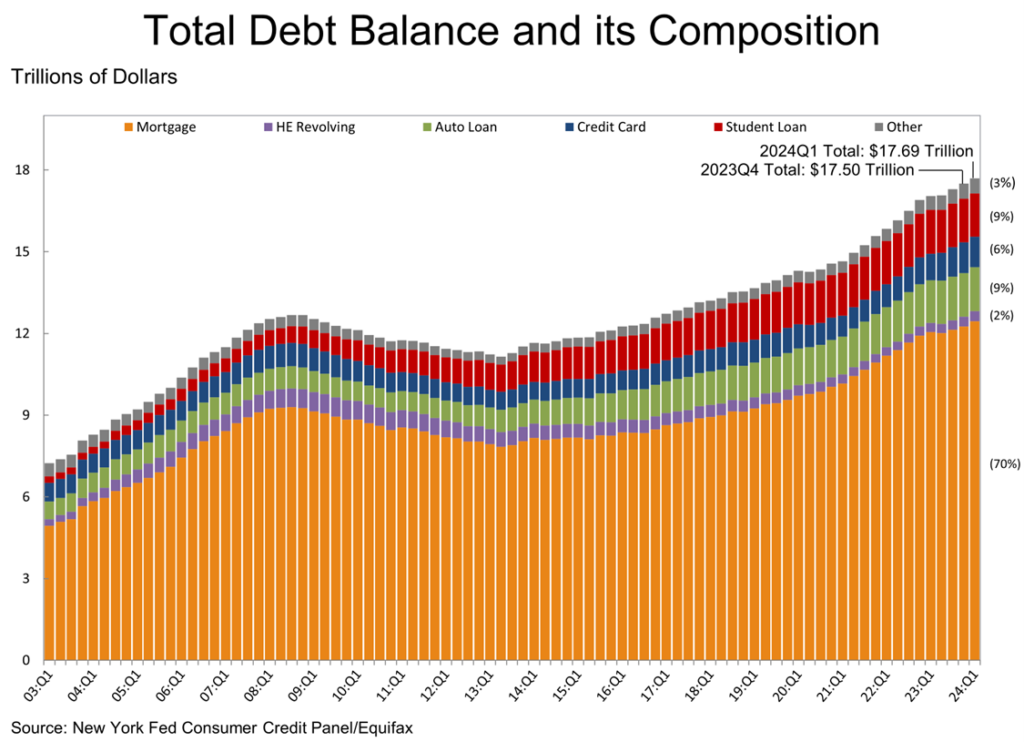
Consumer debt burdens continued its rise, with housing debt continuing to make up the largest majority of consumer’s balance sheets even as mortgage originations are at their lowest level since 2008.
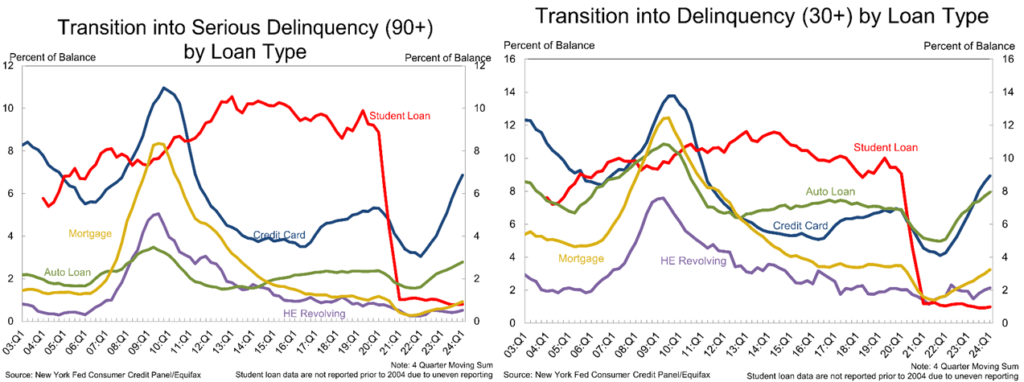
While early (30 days late) delinquency numbers are still below their long-term average, the transition to serious delinquency (90+ days late) rocketed to the highest levels since 2008 for Credit Cards and Auto Loans. Interestingly, bankruptcies remain at a 30 year low.
According to Deloitte, there is a sharp contrast between the lower- and middle-income and high-income brackets on perceptions of financial situation.
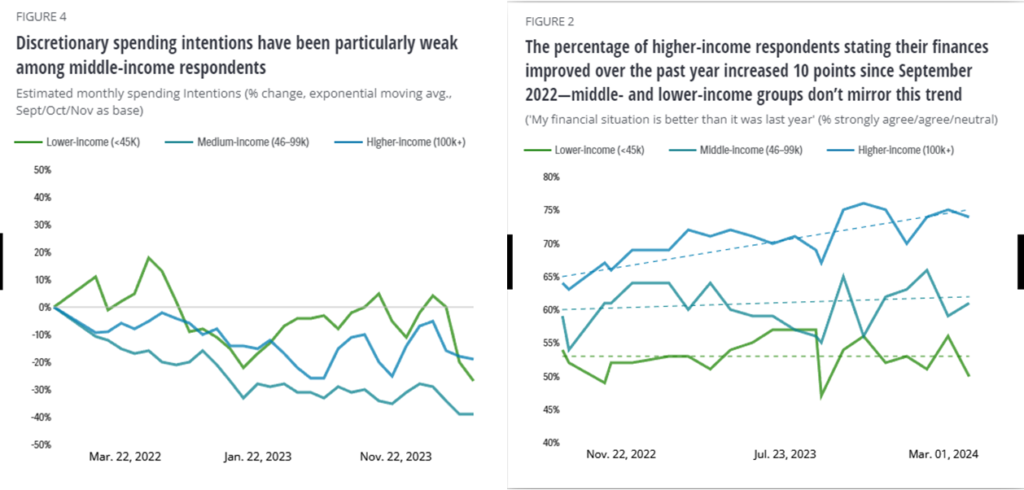
Discretionary spending intentions have collapsed among all respondents, but most drastically in the lower-income bracket. Many have theorized, including the SF Fed, that lower income respondents had an excess of savings due to pandemic-era stimulus, which has run dry for this cohort. As we discussed in our March 2024 review, pandemic era savings were finally projected to run out sometime during 2024.
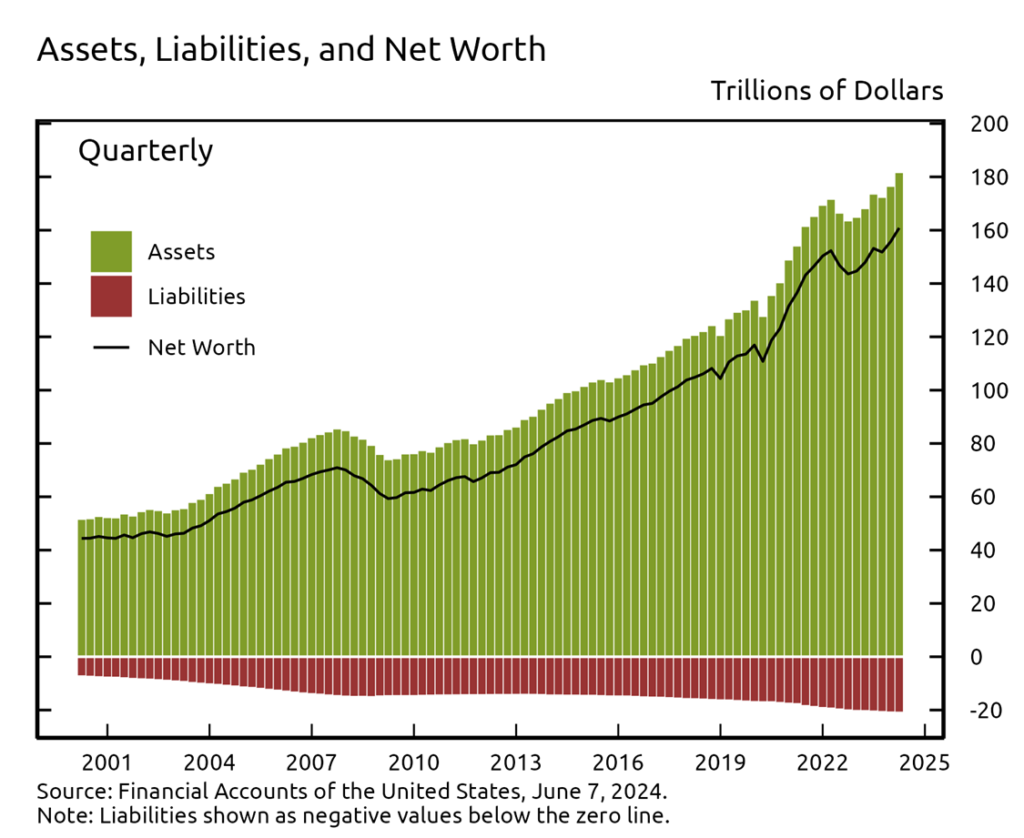
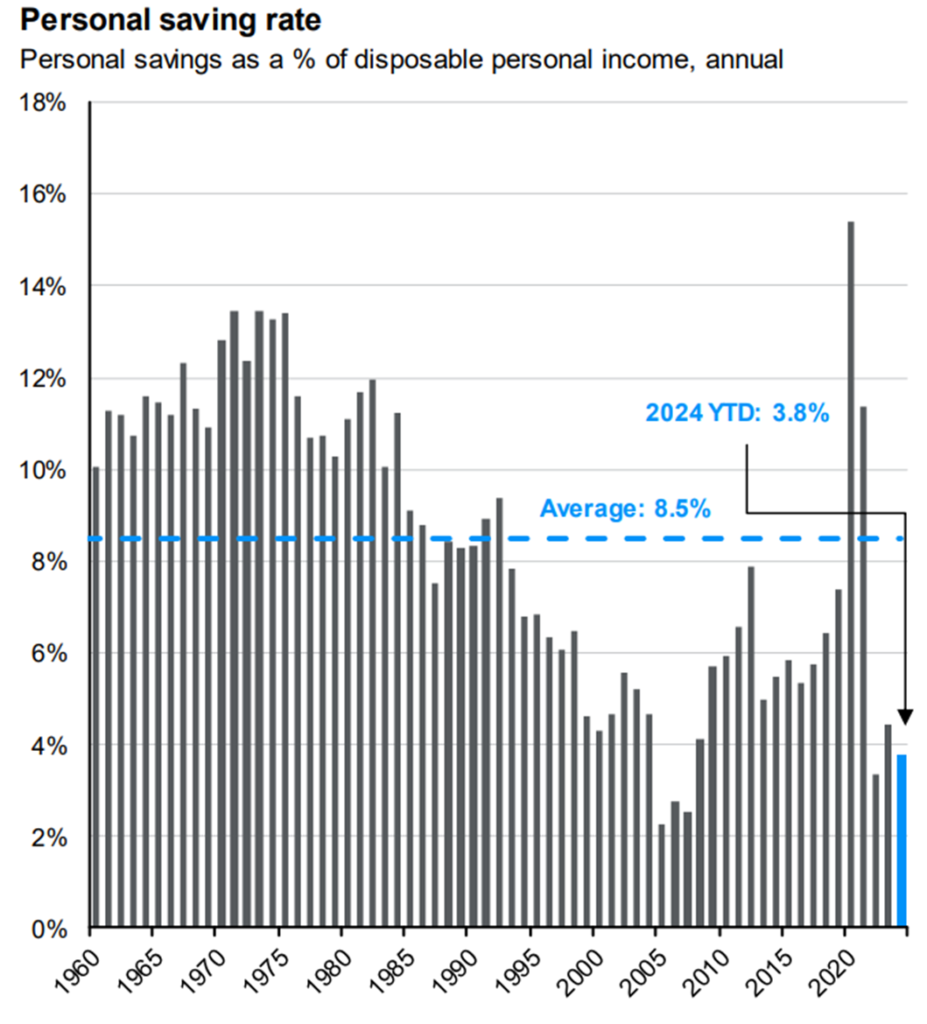
Consumer savings rates remain far below the long-term average of 8.5%, with a YTD savings rate as a percentage of disposable income being just 3.8%. However, household wealth is the highest it has ever been thanks to high house prices boosting equity and increasing salaries. Personal consumption remained unchanged in May, coming in at 2.6% year over year. It remains to be seen if consumer spending will slow below this level by year end.
