
Weyerhaeuser Offers Industry Leading Asset Portfolio
| Price $33.13 | Dividend Holding | October 15, 2024 |
- 2.84% Yield.
- Industry-leading 90% of revenue comes from working timberland rather than leasing it for harvesting rights (stumpage)
- Largest timberland holdings in North America with more than 10.5 million acres.
- Long-term tailwinds from historic pent-up demand and lows in new housing.
- Timber assets generally appreciate with inflation and tree growth.
Investment Thesis
Weyerhaeuser (WY) is the largest timberland REIT in North America. It owns 10.5 million acres in the US, and licenses 14 million acres in Canada for logging. Additionally, it operates 35 mills with the capacity of 6 billion board feet per year in finished lumber and 4.1 billion square feet of flat and engineered lumber.
| Asset | Asset Value (Per Share) | % of total |
| Timberland | $39.35 | 89.6% |
| Other | $0.68 | 1.5% |
| Milling inventory | $0.84 | 1.9% |
| PPE | $3.07 | 7.0% |
| Total | $43.94 | – |
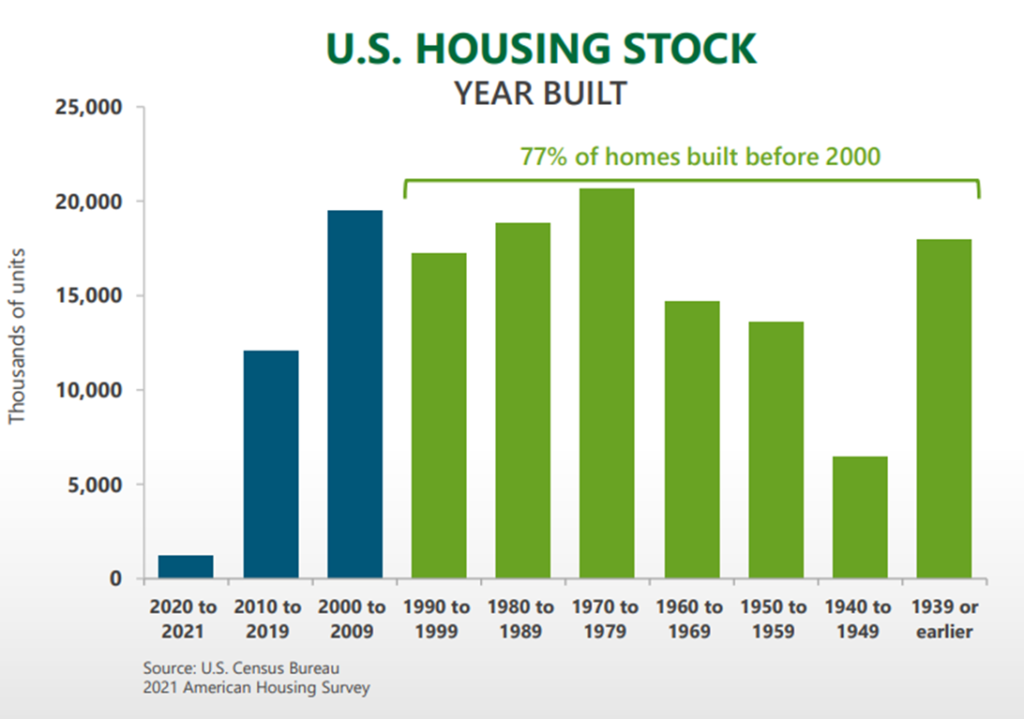
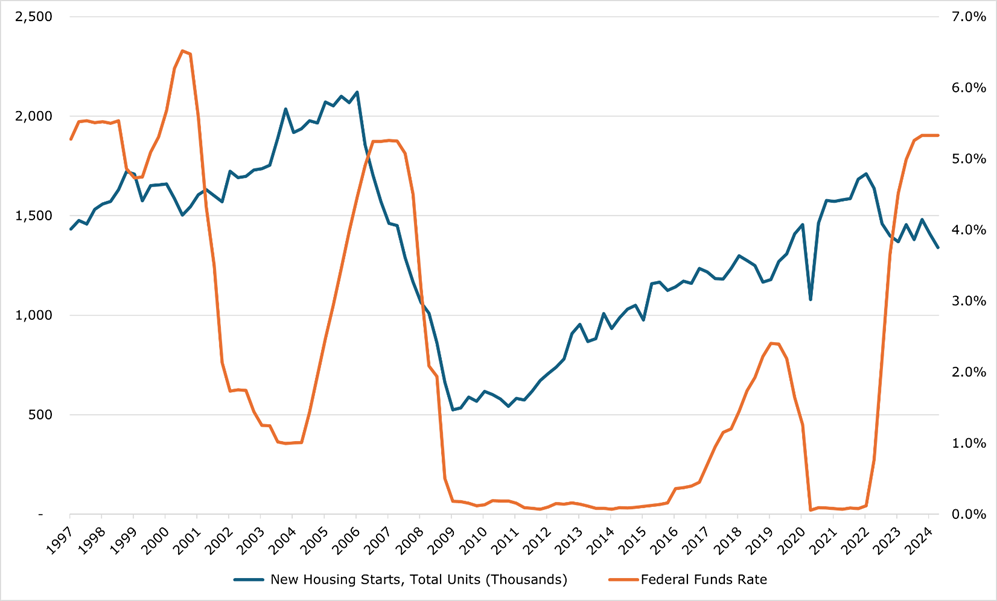
While there is currently a soft market due to both uncertain economic conditions and high interest rates, the Fed rate cuts will spur a recovery in the lumber market. With 77% of housing stock in the US built before 2000, there is substantial pent-up demand on the horizon for housing construction. The US is still short more than 4.5 million housing units despite around 1.5 million new units built in 2023. According to Realtor.com, there were 1.7 million new renter/owner aged households created in 2023. Until the upswing, we believe that WY is in an industry-leading financial position backed by the largest timberland asset portfolio in North America and has a very safe 2.4% yield.
Estimated Fair Value
EFV (Estimated Fair Value) = EFY25 FFO (Funds from Operations) times P/FFO (Price/FFO)
EFV = E25 FFO X P/FFO = $1.75 x 23.1x = $44.43
While we expect some headwinds in funds from operations due to lumber pricing continuing to slump, we believe WY trades at a discount to its asset value and earnings power. Thus we feel that a price to funds from operations ratio of 23.1x both brings it more in line with our estimate of its massive asset value and earnings potential from its continued footprint and output expansion.
| E2024 | E2025 | E2026 | |
| Price-to-Sales | 3.3 | 3.1 | 2.9 |
| Price-to-Funds from Operations | 26.9 | 19.0 | 16.9 |
Market Conditions
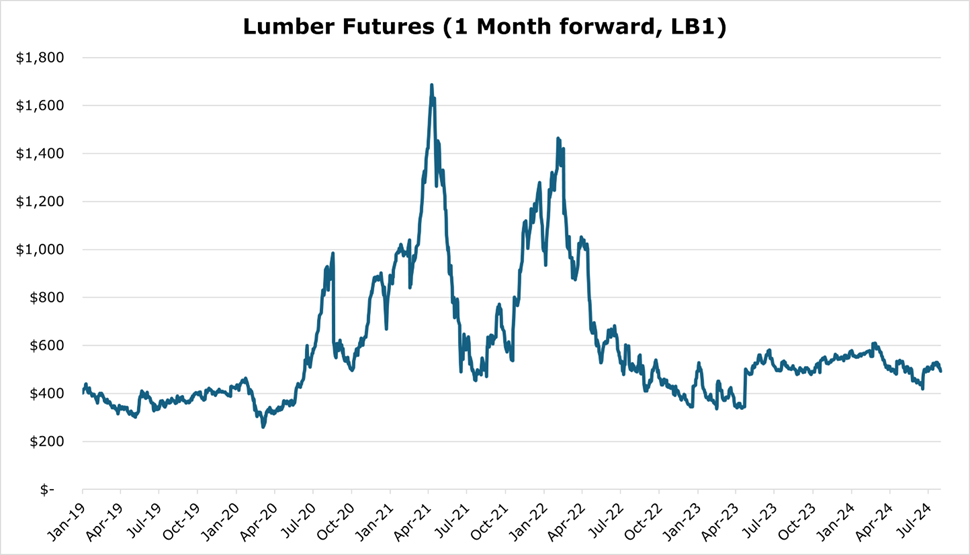
As discussed in our PotlatchDeltic article, the slump in lumber prices has taken a toll on mill assets, with more than 1.6 billion board feet capacity closing across 13 mills in North America – or around 2% of total capacity.
Lower rates should help housing starts and drive increased lumber demand which will in turn improve timber volumes and possibly pricing. For a more detailed view, see our PotlatchDeltic article.
Core Business
| 6 Months Ending June 2024 | ||
| Segment | % of Total Revenue | EBIT Margin |
| Timberland | 21.3% | 20.2% |
| Wood Products (Mills) | 72.9% | 55.1% |
| Real Estate | 5.8% | 11.9% |
| Company Wide | – | 12.4% |
WY derives 90% of its timberland revenue from harvesting, rather than stumpage (the right to harvest). The closest competitor is PotlatchDeltic, with 81% harvesting.
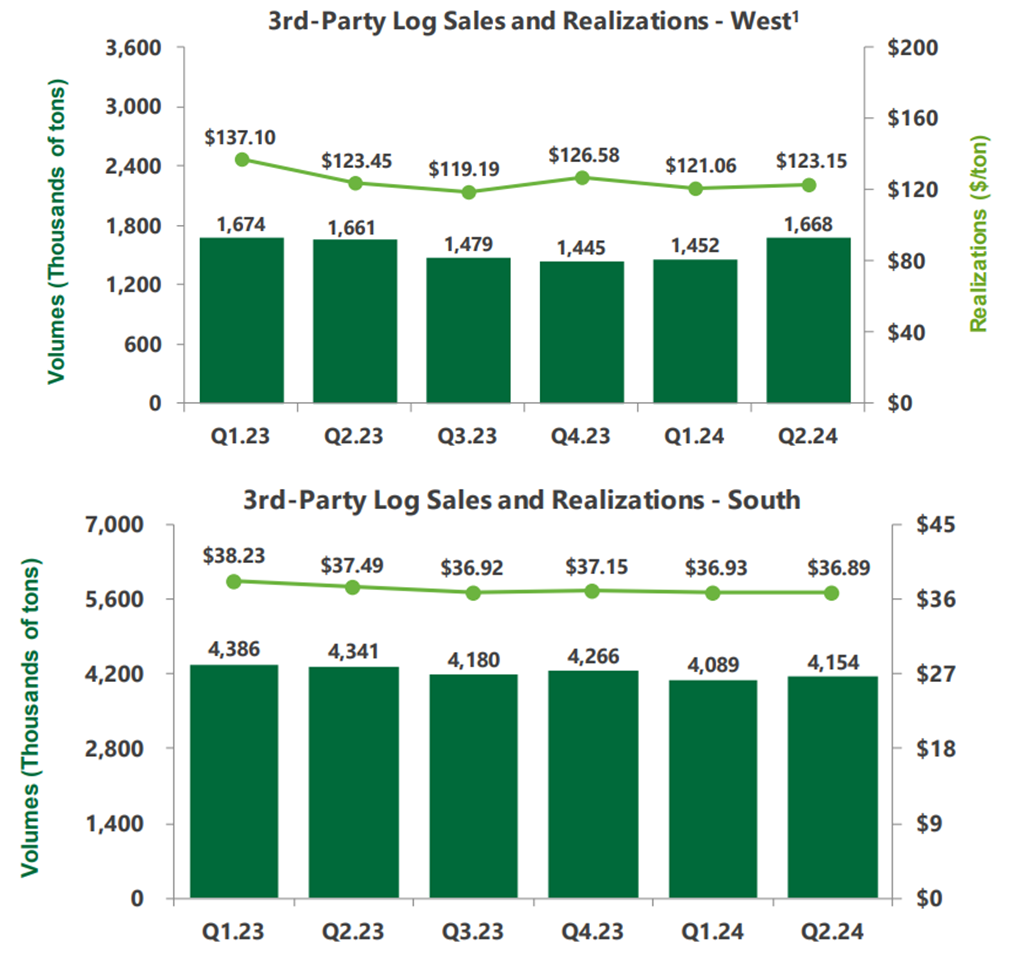
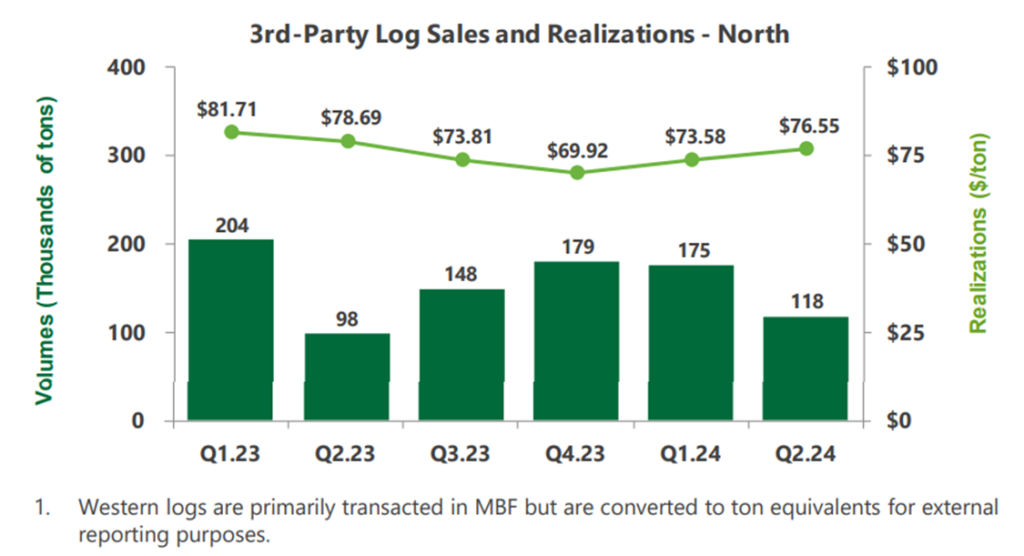
For the quarter ending June 2024 the West and North regions saw higher price realizations on a year-over-year basis, with the South remaining flat. The South and West had slightly better volumes thanks to favorable weather conditions.
Compared to competitors, WY’s large pacific northwest holdings has given it a large export business, including a ‘multi-decade relationship’ with Japanese developers. For the full year 2023 WY exported 24% of its northwest timber, with approximately 67% of exports going to Japan. We feel this number could continue to grow in both volume and price realizations with the continued curtailment of lumber operations in British Columbia.
WY plans to increase its footprint in the western and southern timberlands, embarking on $1 billion in acquisitions by 2025, of which it has spent $775 million and acquired 251.8 thousand acres of timberland so far.
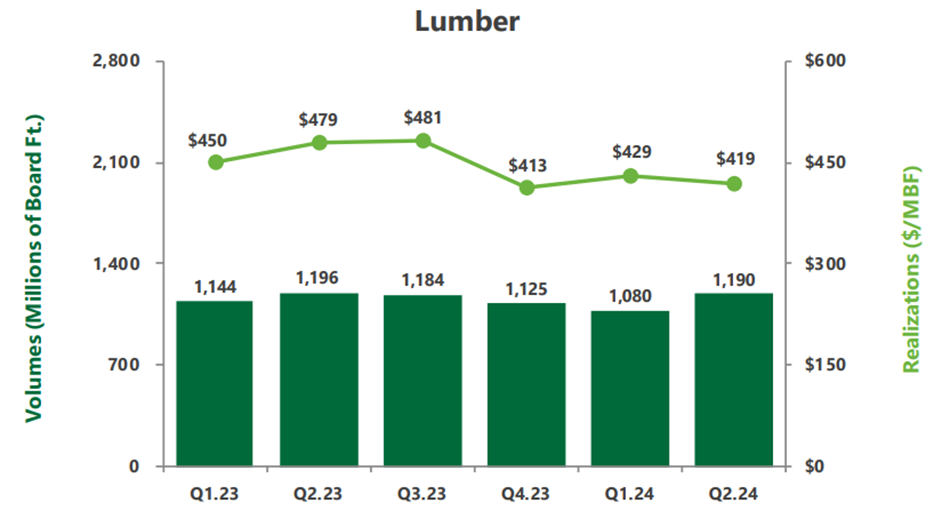
The Wood Products segment represents all milling operations. WY is the second largest board lumber producer in the US, and the #1 engineered wood producer. As of the quarter ending June 2024, WY has 12% operating margin for milling operations despite the large overcapacity present in the US. Sales for board lumber decreased by 2% year over year, with prices falling by 14.3%.
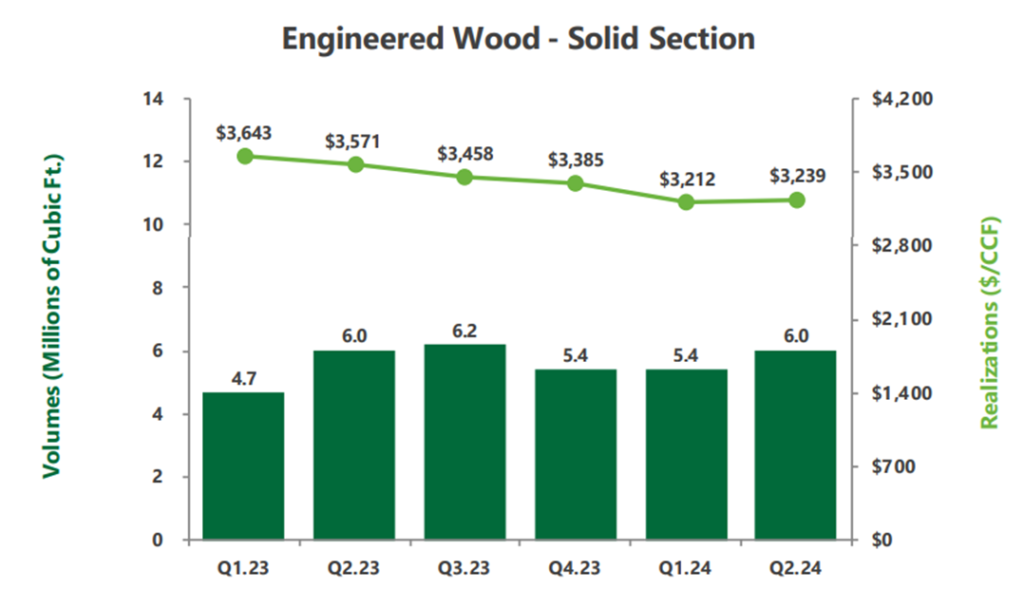
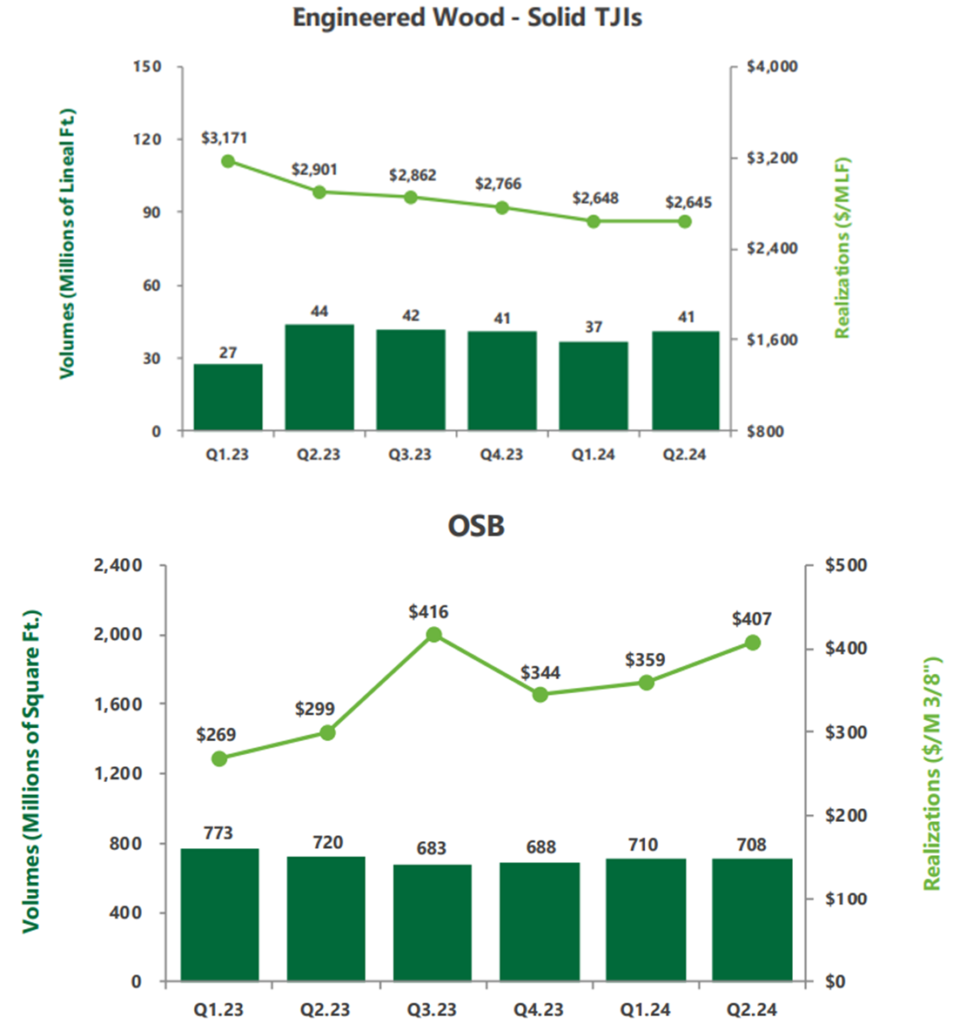
In engineered and particle board products, realized prices experienced a steady decline, with volumes remaining flat.
As previously discussed, real estate starts have hit cyclical lows. We believe that as consumers and developers price in interest rate decreases, housing starts will increase in tandem.
Finally, the ENR (real estate, energy, natural resources) business makes up both solar and mining contract options and real estate sales. For the first half of 2024, the ENR segment has an operating margin of 55%, offering EBITDA of $119 million. More specifically, WY is targeting growing the energy and natural resource component of the business to $100 million in EBITDA per year by 2025. For the first half of 2024, that smaller component of the ENR segment reported $53 million in EBITDA. In our view, the shift toward more energy and natural resource contracts shows the company’s flexibility and initiative to maximize value from its vast asset base.
Risk
Given the slowdown in housing, there is still a substantial oversupply of lumber mill capacity in North America. We remain uncertain when an upswing in construction will occur, as it typically lags rate cuts by a year.
Given WY’s business is almost exclusively linked to timber and production of finished wood products, if the economy deteriorates further from here it would likely harm the profitability of WY and therefore the dividend would be at risk.
Financials
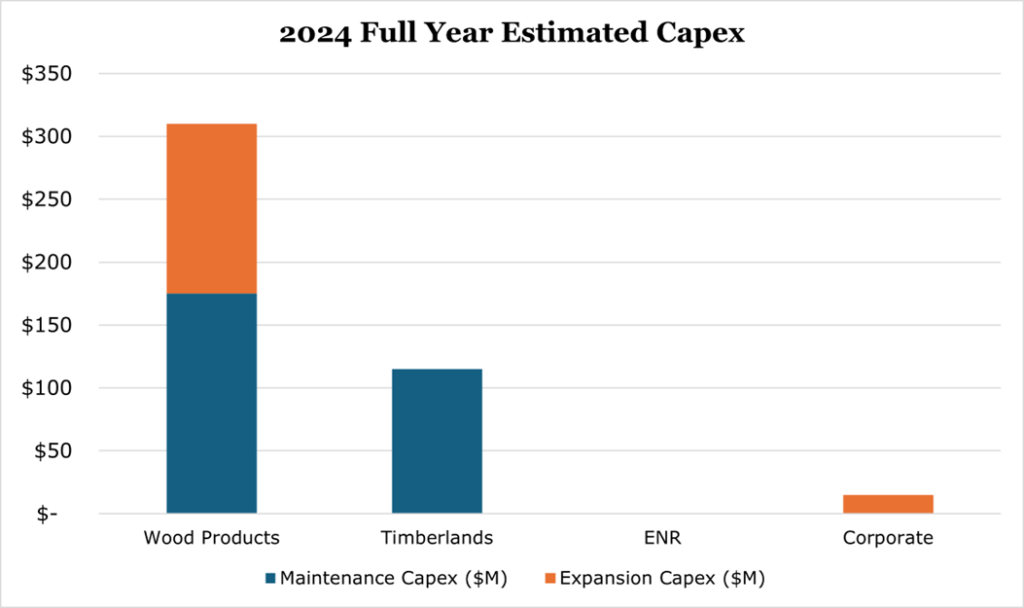
Historically WY spends between $440-$470 million on capex per year, expecting 2024 to end with $440 million in capex. Though, management has stated that it is targeting a small contraction down to $420-440 through 2025. Generally, around 66% of capex spending is utilized for maintenance operations including purchasing more acres to replace depleted timberland assets or buying new equipment in the wood products segment. The largest component of expansionary spending in 2024 is continuing a large sawmill modernization project to support continued footprint expansion in the south.
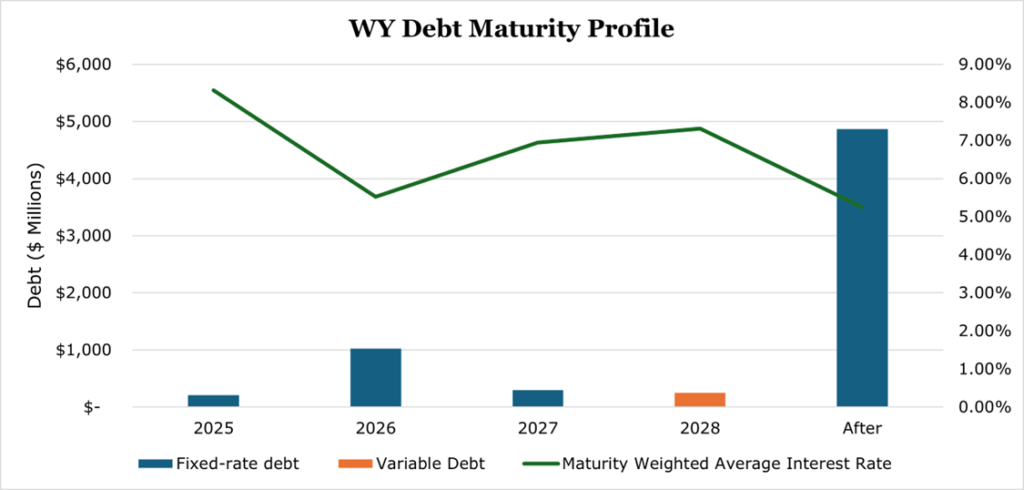
WY Targets 75-80% of funds available for distribution (funds from operations less capex) to be paid out to investors through both dividends and share repurchases. Additionally, it targets around 5% of annual base dividend growth, currently yielding 2.84% or $0.94 per year. The remaining cash is available for acquisitions, debt paydown, or for additional share repurchases. Currently, WY has a BBB rating on its debt, with a net debt to EBITDA of 3.2x below its 3.5x target. While 3.2x may be considered a high figure for a commodity market that is highly cyclical, WY has a substantial holding of real assets to back the debt and a trailing twelve-month free cash flow of $1 billion.
Conclusion
WY leads the timber REIT sector in financial position, margins, and scale. Despite the down cycle seen in the lumber market, there are long-term tailwinds for construction and some short-term pricing tailwinds from shutdown of Canadian lumber assets. While we are unsure when the upcycle will begin, investors can take advantage of WY’s 2.8% dividend yield backed by both its real asset holdings and $1 billion in annual free cash.
Competitive Comparisons