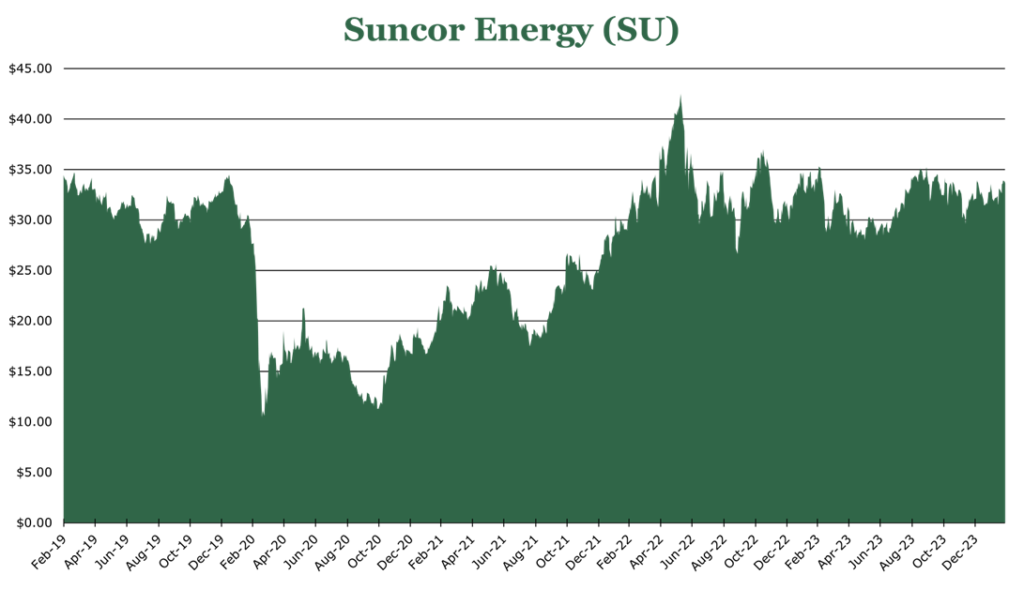

Suncor Digs Out Strong Total Return with 6% Production Growth
| Price $33.85 | Dividend Holding | March 8, 2024 |
- 4.6% dividend yield, share repurchases tied to net debt.
- 745.7 mboe/d in aggregate production in 2023, the highest in firm history.
- Targeting a 6% increase in production in 2024 without per bbl cost increases or accelerating depletion.
- Refinery utilization rates in 2023 averaged 90%, with a projected increase to 94% in 2024.
- Fortress balance sheet, with a debt to EBITDA of under 1.0x and $4.6 billion in free cash flow.
- Significant tailwinds with OPEC+ cuts and additional transport capacity to the West Coast coming online in 2024.
All figures are in USD unless otherwise stated. Assumes CAD/USD = 0.7409
Investment Thesis
Suncor Energy (SU) is a vertically integrated Canadian producer of petroleum products. 2023 was the best-ever year for output and the second-best financial result year. Suncor is predicting stronger refinery utilization in 2024, with 6% production growth.
Further OPEC+ cuts, potential US Demand increases with a rate cut, and additional transportation capacity via the Trans Mountain Pipeline present an opportunity for Suncor to enhance its market access and potentially realize better pricing for its products than current guidance.
With the share price falling 1.4% since February 2023 despite the firm’s outlook improving, we believe that Suncor is an attractive purchase for total return through the 4.6% dividend yield and capital appreciation.
Estimated Fair Value
EFV (Estimated Fair Value) = EFY25 EPS (Earnings Per Share) times P/E (Price/EPS)
EFV = E25 EPS X P/E = $4.6 X 10.0 = $46.00
| E2024 | E2025 | E2026 | |
| Price-to-Sales | 1.2 | 1.1 | 1.1 |
| Price-to-Earnings | 10.7 | 10.0 | 9.3 |
Background
Oil sands, as the term suggests, are composed of sand and clay that are rich in bitumen. Approximately 20% of Canada’s oil sands are situated near the surface, allowing for extraction through open-pit mining. The remaining 80% are extracted using in-situ production, a method akin to hydraulic fracturing.
Oil sand operations necessitate higher initial and operational capital compared to other extraction techniques. However, this is offset by the lower-than-conventional-crude decline rate of reserves without sacrificing the recovery rate. The average decline rate for a conventional crude operation is around 10%, while Suncor expects a firm-wide decline rate of 5% in 2024.
Because oil sands are very viscous, they are diluted by around 1-3% using lighter-than-bitumen products like Naphtha or Diesel to create a transportable mixture called Dilbit.
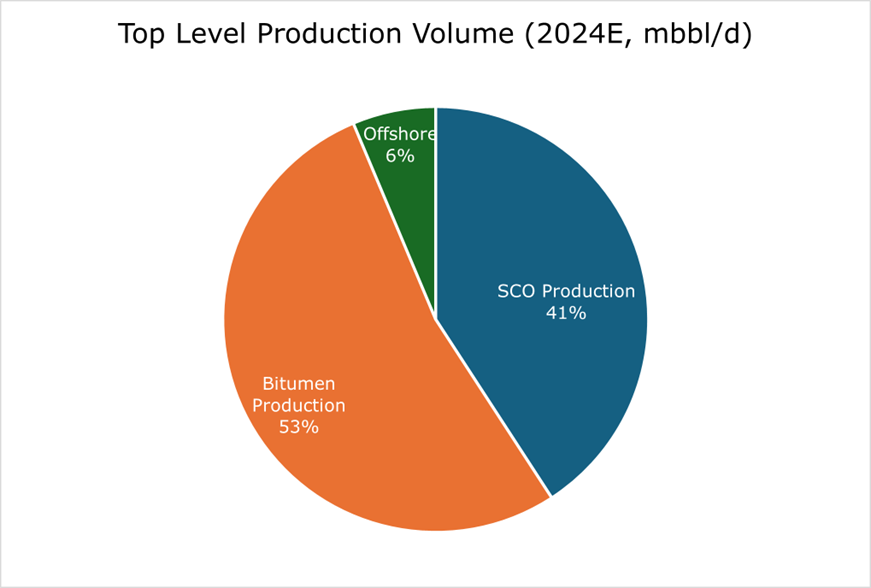
Dilbit can then be processed into high-grade oil products by larger, more specialized refineries capable of cracking heavy oils. Suncor utilizes approximately 42% of the produced bitumen in this way. The remaining 57% is “upgraded” to SCO (synthetic crude oil) before being sent to other refineries.
The reason behind this conversion is typically additional market access, as SCO and WTI are nearly chemically identical. Historically, SCO traded at a premium to WTI due to its lower sulfur and metal content. However, increased development of cheap, high-quality oil fields across the US has seen it trade in step with WTI since the pandemic.
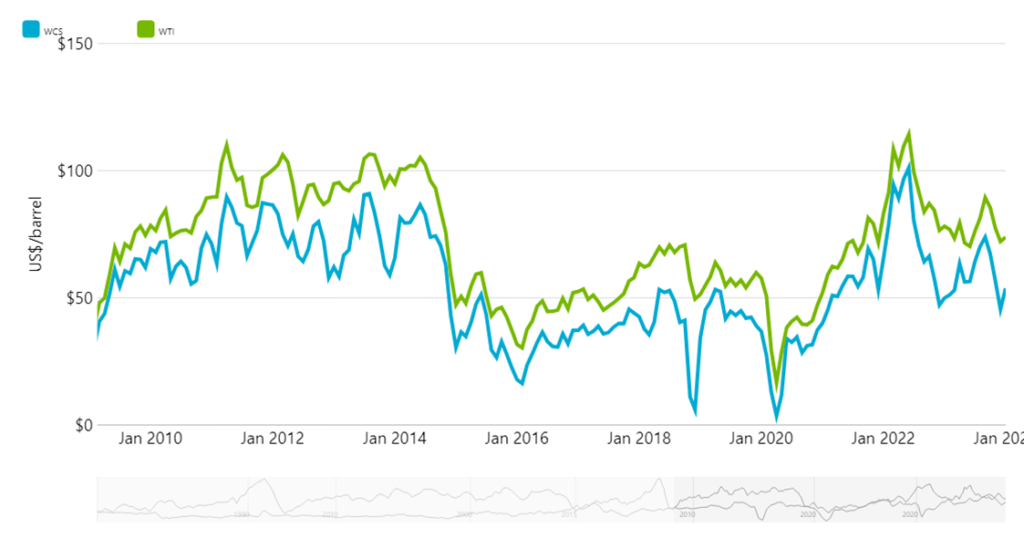
Dilbit can be traded on the open market with nominal enhancement as WCS (Western Canada Select). WCS is the lowest grade of petroleum commonly traded. Historically, the price difference between WCS and WTI has been 10-20%.
Operations
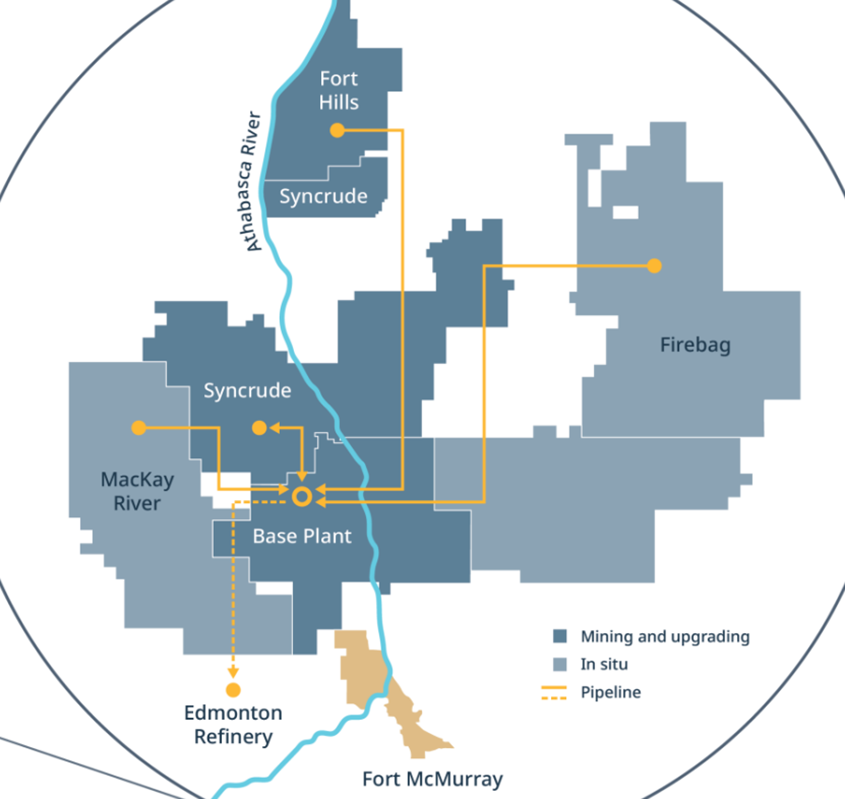
Suncor’s production is heavily concentrated in oil sands, with some conventional crude production offshore.
| Type | 2023 Production (thousands of barrels of bitumen per day) | |
| Millennium and North Steepbank | Open Pit | 250 |
| Mildred Lake and Aurora North (58.74%, Operated by Syncrude) | 212 | |
| Fort Hills | 147 | |
| Firebag | In Situ | 217 |
| MacKay River | 34 |
A critical component of both open-pit and in-situ is conversion. These conversion facilities allow oil sands to be moved to refineries. Open-pit mining had a utilization of around 90% capacity. In the in-situ area, utilization averaged 95% during 2023.
The largest developments in the year were the purchase of the remaining interest in the Fort Hills project and the sale of the UK business. Early in 2023, Suncor sold the UK arm of the business and offloaded several other smaller operations, which netted $1.8 billion in proceeds. Fort Hills was previously at 54% interest, and Suncor purchased the remaining for $2.2 billion. This purchase added approximately 61,000 bbl/d (barrels per day) of bitumen production and added 675 million barrels of reserves.
Suncor has a significant operating interest in several offshore projects. The only one operated by Suncor is the Terra Nova, a floating production storage and offloading ship. The ship operates on the coast of Newfoundland and Labrador. The ship was removed in 2019 after a large crack formed in the hull. The vessel then underwent an extended overhaul and, after delays, re-entered service in November 2023. Production is expected to be in the 29 mbbl/d (thousands of barrels of oil per day) neighborhood, with a 10-year service life.
| Project | 2023 Production (mbbl/d) |
| Hibernia (20%) | 14 |
| Hebron (21%) | 25 |
| Terra Nova (48%, Suncor Operated) | – |
| White Rose (39%) | 5 |
Downstream and Midstream
Refinery utilization in 2023 averaged 90% for the whole year, with 99% in the second half of the year and 82% in the first half. The 90% figure is a miss for 2023 guidance, which is attributable to a slow restart of Commerce City operations and delays in the Terra Nova restart. However, Suncor still realized a very favorable capture margin, the percentage of theoretical profit margin (crude price less refined product sale price) based on benchmark prices, which averaged 103% in 2023.
Suncor has industry-leading refinery utilization, averaging above 90% for the past 10 years. Additionally, due to the large portion of inputs being its own, its refineries are far above peers for profitability, making an average of around $10/bbl in EBITDA over the trailing 5 years.
The total storage capacity for Suncor is 50 million barrels of oil across Canada and the US Gulf Coast. Current storage is 60% WTI, 20% WCS, and 20% SCO. Typically, inventory has a turnover of around 45 days, depending on transport time.
| Location | Throughput Capacity (mbbl/d) | Gasoline/Distillate/Other |
| Edmonton | 146 | 38/56/6 |
| Sarnia (Ontario) | 85 | 45/40/15 |
| Montreal | 137 | 35/39/26 |
| Commerce City (Colorado) | 98 | 48/34/18 |
Expansion and Investment
Investment capital is concentrated on expansion or efficiency in existing operations, though there is a significant investment in the West White Rose exploration project.
| Investment | Cost ($ millions) | Description |
| West White Rose Project | $370.5 | Production Expansion |
| Other Exploration | $148.1 | |
| Firebag and MacKay Wellpads | $266.7 | |
| Mildred Lake Extension (58.74%, Operated by Syncrude) | $185.2 | Reserve Replacement |
| Environmental Improvement (Boiler Replacement, Cogeneration) | $518.6 | Environmental |
| Other | $185.2 | New Equipment for Fort Hills |
The White Rose Project is adjacent to the Terra Nova field, and Suncor will hold a 39% interest. Construction started in 2017, though it was halted due to both COVID-19 and disagreements with royalties to the Newfoundland and Labrador government. In 2021, Suncor invested in the project once it resumed construction. The project is expected to reach initial oil capacity in the first half of 2026 and produce 80 mbbl/d.
The Mildred Lake expansion is a replacement for the existing Aurora North mine once it reaches the end of its production life, which is expected to be in 2026. Mildred Lake is expected to produce its first oil in 2025 and will add 738 million barrels of bitumen to reserves or approximately 14 more years of life.
Environmental projects include a coke boiler replacement at the main facility in Edmonton, which will provide higher energy efficiency. Cogeneration is a new initiative to put the heat produced from in-situ operations back into the cycle to reduce energy loss. Both of these may decrease costs over the long term, though they are more environmentally beneficial in the short term.
Risk
One of the primary risks facing Suncor is Canada’s usage of carbon pricing, a levy on the per metric ton emission of carbon. In 2024, it will increase to CA$80/metric ton and will step up by CA$15/metric ton a year until it hits CA$170 in 2030. Across the company, Suncor produces around 28.8 megatons of carbon per year or CA$8.4/bbl in taxable emissions. However, current exemptions and carveouts allow Suncor to pay only CA$1.7/bbl in costs. If the regulations substantially change, it could result in an extremely high yearly tax. Thus, Suncor is targeting a 10-megaton reduction in emissions by 2030.
However, we feel that any substantial change in regulations that would radically increase costs or reduce operational footprint is unlikely. In our view, the Canadian government will continue to protect the domestic oil sands industry, given that it makes up just under 10% of the total GDP.
Production Outlook
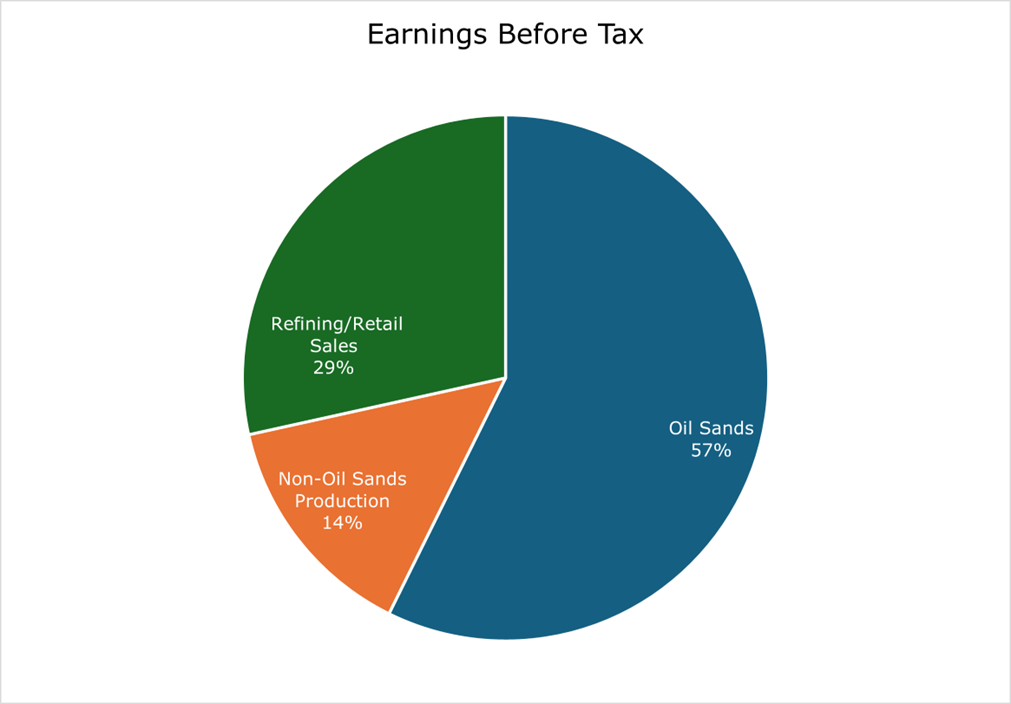
Oil sands and upstream products remained the dominant earner for Suncor through 2023, with 2024 remaining the same. Aggregate production across Suncor was 745.7 mboe/d (thousands of barrels of oil equivalent per day), with about 90% oil sands. Adjusted funds from operations came in at $9.85 billion, or $8.8 billion in earnings before tax.
| Location | Production Cost ($/bbl, 2024E) | Production Cost Year over Year Change |
| All Oil Sands Operations | $21.86 | -4.2% |
| All Syncrude JV (58.74%) | $27.04 | 7.8% |
| Fort Hills | $25.56 | 22.8% |
Production costs are expected to increase at Fort Hills, partially due to structural problems in some of the pits, new equipment purchases, and other startup costs. Production is expected to expand by around 6% in 2024 at the midpoint without a meaningful increase in reserve decline or cost.
For 2024, refinery utilization is expected to be marginally higher, at 94%. The estimated capture ratio is expected to be 100% or higher. We believe that the capture ratio and utilization will be heavily weighted to the first part of the year as there is very little scheduled downtime. Total refined product sales are expected to be 565 mbbl/d through 2024 or about a 2% increase year over year.
The spread between WCS and WTI opened up in 2023 to $18/bbl. The reason for the increase in the spread is a mixture of increased US production and pipeline capacity bottlenecking. Due to bottlenecking, it costs approximately $10/bbl to move oil from Alberta to the US Gulf Coast by pipeline and $17/bbl by rail. Suncor expects the WCS-WTI spread to narrow to $16/bbl in 2024 due to increased capacity in pipelines. We believe that the spread may narrow further, given the 590 mbbl/d in additional transportation capacity to the West Coast in the form of the Trans Mountain Pipeline. The Trans Mountain Pipeline could equally open up new markets and enhance the realized price for WCS, with most of Canada’s oil exports to Asia being via Henry Hub.
Globally, OPEC+ will cut global production by 2.2 million barrels per day, likely lasting until the end of 2024. Additionally, the EIA has cut its projections for 2024 US oil output growth, showing only 130 thousand barrels per day, a massive deceleration from 2023’s 1 million barrels per day growth.
Financial Outlook
Over the trailing 10 years, Suncor has returned 60% of adjusted funds from operations, currently amounting to a 4.6% dividend yield, slated to be $1.60/share in 2024.
Additional shareholder returns like buybacks are tied to net debt. The current net debt level is $10.3 billion, with the ladder concentrated after the end of the decade. We believe that Suncor will likely decrease debt to the middle $8 billion range through 2024, which will contribute to additional dividend and buyback growth into 2025.
Free cash flow for 2023 was $4.6 billion, which was pulled down by persistently weak oil prices in the second half of the year. Still, Suncor repurchased 4% of its outstanding shares throughout the year.
Despite expectations of flat oil prices in 2024, the 6% increase in production and estimated production cost decrease in Suncor-operated oil sands areas (less Fort Hills) should provide modest earnings growth and margin expansion. If US oil demand recovers to pre-pandemic levels with a Fed rate cut or supply is significantly reduced by OPEC+ cuts throughout the year, Suncor could see better pricing and significant earnings growth.
| ($ billions, 2024E, midpoint guidance) | ||||
| LT Debt + Capital Leases | Sustaining | Dividend | Investment Capital | Buybacks / Debt Reduction |
| $8.9-11.1 | $2.6 | $2.0 ($1.60/share) | $2.1 | 50/50 |
| $6.6-8.9 | 75/25 | |||
| <$6.6 | 100/0 | |||
The company’s industry-leading refinery utilization rates and 2024 production growth, in tandem with tailwinds in oil demand and potentially higher price realization, present a strong total return case. We believe that Suncor is well-positioned for secular earnings growth and continued generous shareholder returns.
Competitive Comparisons