Riley Exploration Explores New Area in New Mexico
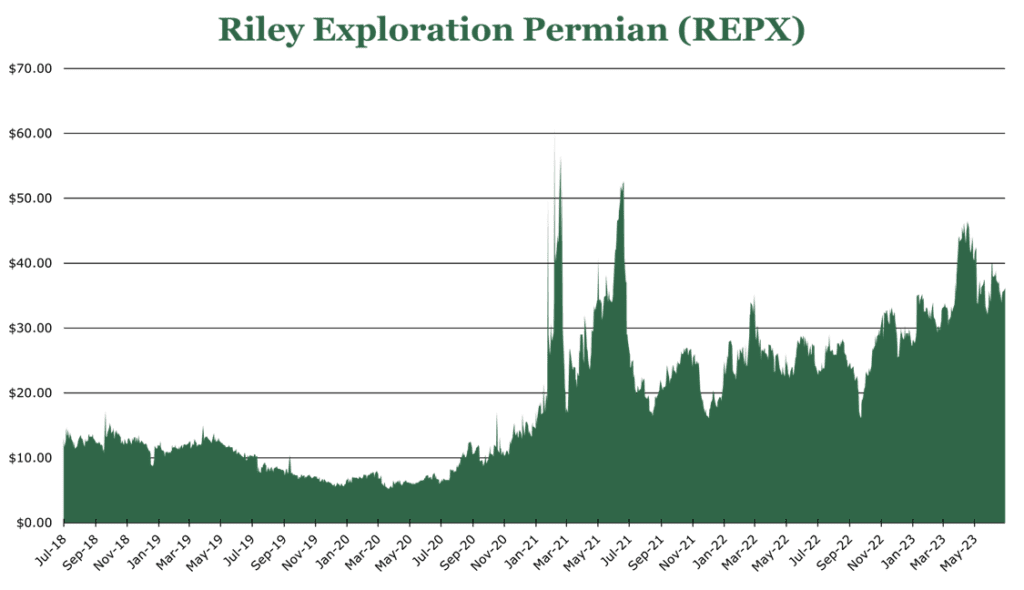
| Price $33.76 | Dividend Holding | July 10, 2023 |
- Strong expansion plans in the same basin in New Mexico, expecting 15% free cash yield from the project and the project being accretive in year 1.
- Expecting an 80% increase in production from FY22, with an 18% decrease in expenses.
- If oil prices stay in the $70 area, REPX expects $42-55 million FCF. Similarly, oil prices around $70 will have FY23 leverage at 1.8x debt to EBITDA.
- OPEC stated no oil output increases until FY24; EIA expects oil prices in the $80 range for 2H23 and 1H24.
Investment Thesis
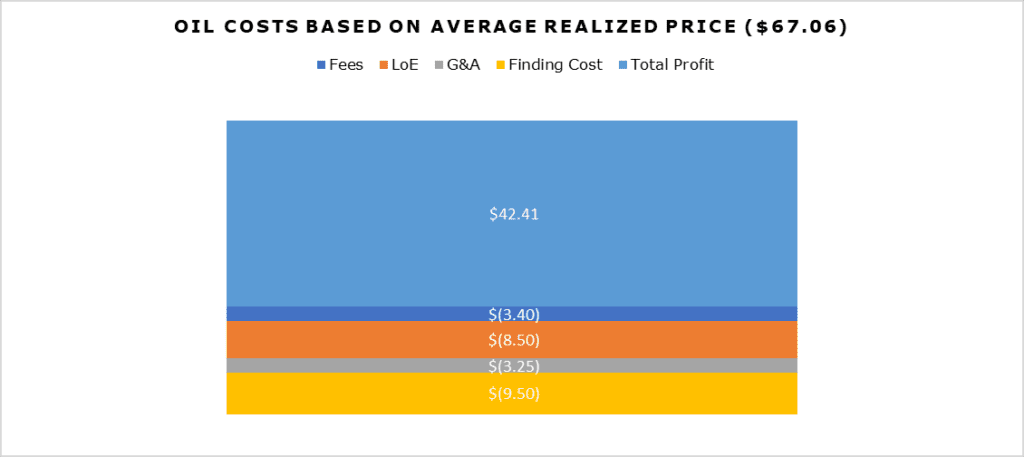
Riley Exploration Permian (REPX) is a Permian Basin Pure Player embarking on a cost structure revamp and volume increase campaign. REPX pays out a 3.68% dividend yield of $1.33 per year. REPX is only around 50% hedged, having a realized income across the company of $67.06/bbl.
REPX’s property in TX has a lower than the median drilling cost, still being very profitable in this depressed oil price environment. With SPR (Strategic Petroleum Reserves) set to reverse and start refilling and OPEC announcing no production increases until FY24, we expect stable pricing near the current $70 levels for the rest of the year. We believe that REPX is a good buy for a dividend investor seeking to gain a dividend yield and appreciation from a producer in a consistently stable and profitable basin.
Estimated Fair Value
EFV (Estimated Fair Value) = E24 EPS (Earnings Per Share) times PE (Price/EPS)
EFV = E24 EPS X P/E = $13.00 X 7 = $91.00
| FY22 | E2023 | E2024 | |
| Price-to-Sales | 1.9 | 1.9 | 1.3 |
| Price-to-Earnings | 4.6 | 4.3 | 2.5 |
Operations
| Cost per Lateral Foot ($/ft) | Decline Rate | MOIC (Multiple on Invested Capital) | Finding and Development Cost ($/bbl) | 5 Year Cumulative Production Per 1,000 Lateral Feet (Mbo/1kft) | |
|---|---|---|---|---|---|
| REPX Holdings | $650-1000 | 75-85% | 2.5-3.3x | $7-12 | 38-41 |
| Typical Permian Shale Producer | $1,000 | 90% | 1.8-2.8x | $13-21 | 30-50 |
REPX has a below-average cost per lateral foot for drilling, which greatly assists in reducing the cost of development, and boosts the return on invested capital.
For FY23, REPX expects production to be, on average, 18.4-19.2 MBoe/, weighted at approximately 70% oil. REPX has 58% of FY23 production hedged for oil and 42% of natural gas production hedged. The average realized price with hedges weighted is $67.06, and the average realized price for unhedged 1Q23 production is $72.76 for oil.
Oil revenues increased 4% year over year, mostly attributed to a volume increase of 32%. The volume increase eliminated the 32% drop in realized price year over year.
The natural gas section saw much worse results than in FY22, completely attributable to the price collapse. In natural gas, volume increased by 39% while realized price decreased by 79%. The story is similar to NGLs in which volume increased by 44% but realized price decreased by 74%.
New Mexico Acquisition and Cost Structure
REPX acquired land in New Mexico in the same geographic band as its legacy assets in Yoakum, TX. For $330 million, the transaction is expected to yield 100 high-quality drilling locations. Expected drilling numbers are around 4MBo/d in oil and 3MBoe/d of other hydrocarbons. As of 2Q23, 4 wells have been drilled in the New Mexico area, expecting 9 for FY23. New Mexico is expected to make up 25-35% of all E&P (exploration and production costs) for REPX for FY23. The New Mexico area is expected to be roughly 34% of FY23’s total production.
Oil Price Environment
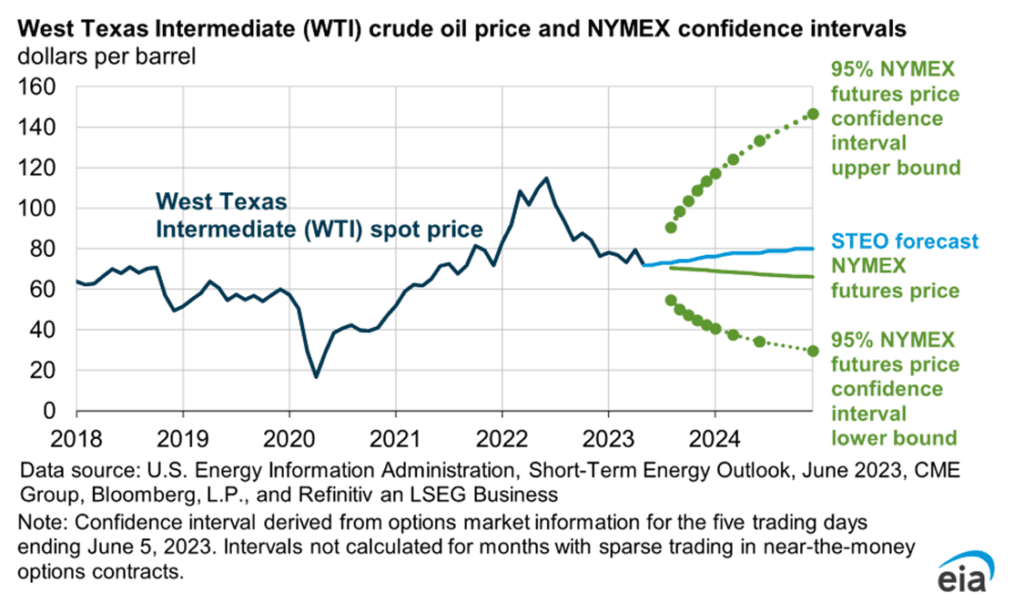
The price of oil and gas has dropped year to date and has more than retraced its spike around the Russian invasion of Ukraine. Earlier in FY23, we expected the WTI (West Texas Intermediate) price to move back above $100 in FY23 with the EIA expected to be a similar $90 figure. However, the impact of Russian oil sanctions has been limited, and Chinese demand has not bounced back as expectedFurthermore the refilling of the SPR has been delayed. While OPEC is expected to keep production down into FY24, the persistent weakness in the global economy will dampen consumption to just an additional 1.6 million bbl/d in FY23, mostly from developing nations. For this reason, we believe that the oil price in 2H23 will likely remain around its current price of $71.79. At this level, REPX expects an FCF of $60-80 million, at least a 7% increase year over year compared to FY22.
Risk
The depression in oil and natural gas prices will adversely affect the top line of REPX. In the oil segment, which makes up 70% of production, volume increases have more than offset the price decrease. The New Mexico acquisition was funded by roughly 1/3 cash and roughly 2/3 debt. In this high-interest rate environment, $200 million in debt with 10.5% interest is suboptimal. However, we believe oil prices are near their lows and, over time will rebound, and the extensive free cash that REPX generates more than covers interest.
Outlook
Cash flow from operations increased 23% year over year, largely attributable to volume increases. On a per-unit basis, operating costs were equal year over year despite persistent inflationary pressures. The New Mexico acquisition is part of a cost structure transformation and scale-upsize. Compared to FY22, REPX expects an 80% increase in production and an 18% decrease in cash G&A expenses. Additional new ventures include onsite power generation utilizing raw natural gas, oil recovery from slurry, and carbon capture and storage. These three potential new areas will be more developed in FY24 and could drive cost savings or revenues.
We expect the dividend to be stable if FCF growth is in the 4% neighborhood, but we could see an increase in FCF yield if oil and gas prices recover.
Competitive Comparisons