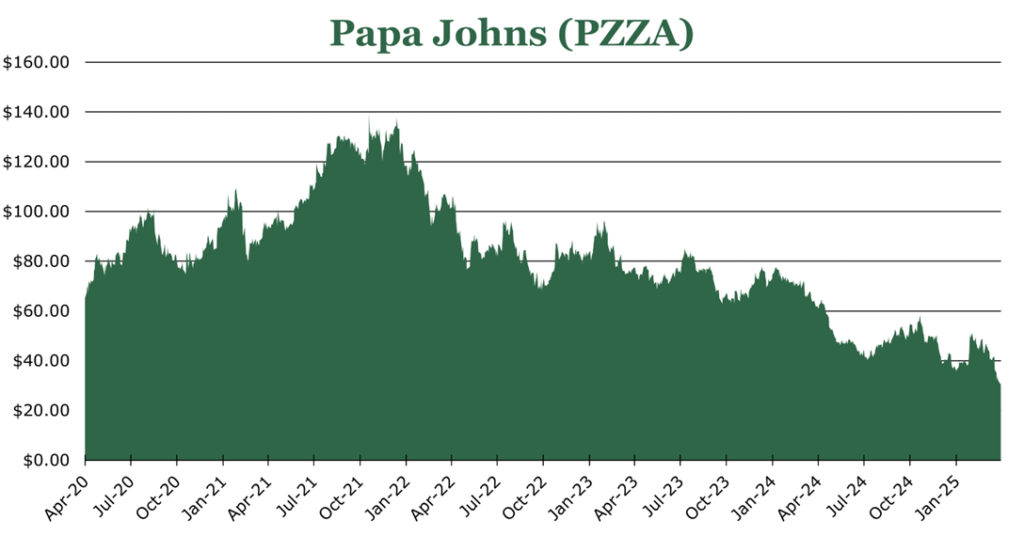
Papa Johns Delivers a Slice of Stability in an Uncertain Market
| Price $31.16 | Dividend Holding | April 19, 2025 |
- 5.9% Dividend Yield.
- QSR (quick service restaurants) have historically been resilient in economic downturn, sometimes even seeing volume increases.
- Improved unit-economics for franchisees by waiving certain fees to drive down payback period from 5.5 years to 3.2 years, which we believe will incentivize expansion.
- Papa Dough loyalty program has 17.5 million active members, up 21% since 2023, thanks to the program revamp providing better value and more tailored discounts.
- Pivot to value offerings to boost short-term volumes and ensure market share expansion, making it up over the long term through commissary markup increases over the next 5 years.
Investment Thesis
Papa Johns (PZZA) is a global Pizza QSR (quick service restaurant), with 5,478 franchised locations and 552 corporate locations. Historically, Papa Johns has been third in the global pizza QSR market and has a domestic North American market share of around 25%. Additionally, QSRs have typically not lost volume during recessionary environments making them solid defensive additions to a portfolio.
What makes Papa Johns compelling compared to the rest of the QSR segment is its margin transfer strategy and aggressive growth despite economic uncertainty. Over the short-term, Papa Johns is sacrificing margin in exchange for boosting volumes and market share through value offerings. Additionally, it is encouraging expansion of existing franchise partners through waiving marketing contributions, which has reduced the payback period by 2.3 years. Over the long term, Papa Johns believes this will strengthen its loyalty position among its existing footprint and penetrate markets where it currently lags peers. Overall, we believe this will allow for much stronger operating margins by 2028.
With macroeconomic conditions looking more pessimistic over the medium term, we believe that Papa Johns represents a strong countercyclical opportunity. It has a 5.9% dividend yield providing a strong income base and is continuing to emphasize growth through both value-focused offerings and incentivizing expansion to franchisees who are regional experts.
Estimated Fair Value
EFV (Estimated Fair Value) = EFY26 EPS (Earnings Per Share) times P/E (Price/EPS)
EFV = E26 EPS X P/E = $2.40 X 19 = $46.00
| E2025 | E2026 | E2027 | |
| Price-to-Sales | 0.63 | 0.61 | 0.56 |
| Price-to-Earnings | 17.4 | 12.6 | 9.3 |
SeekingAlpha Analyst Consensus
Historic Context
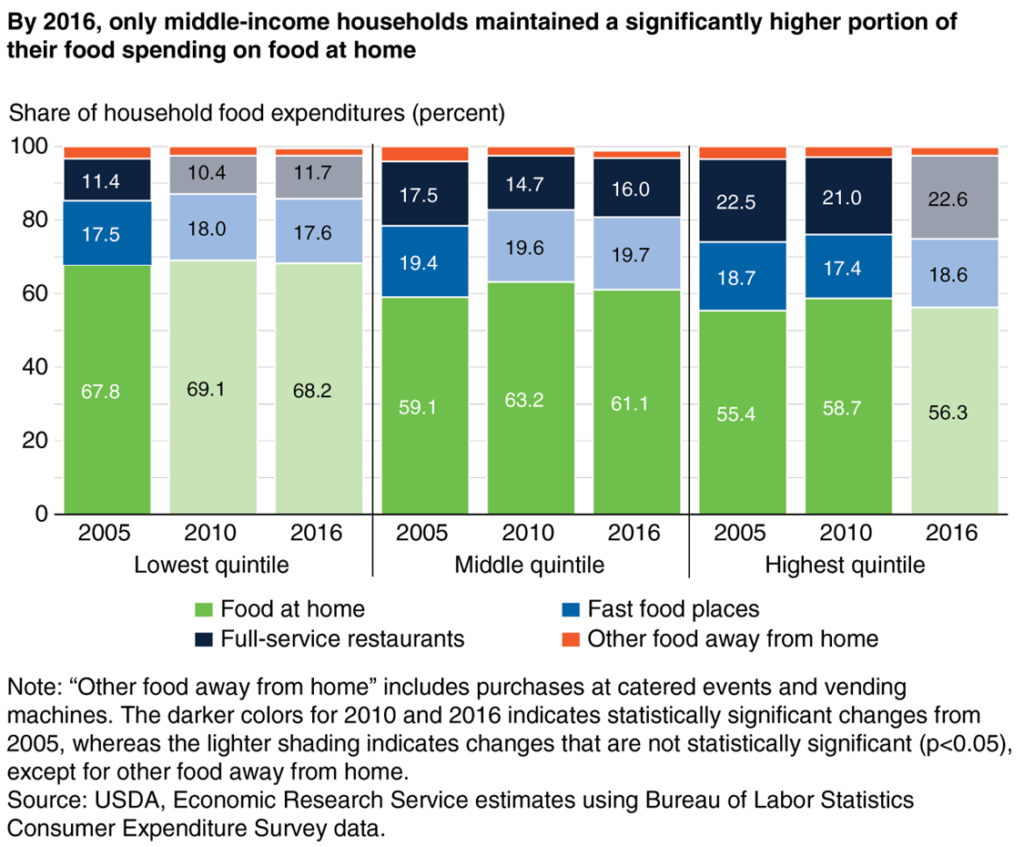
Pizza chains and other QSRs (quick service restaurants) have historically offered a solid defensive position during economic downturns. During the 2008 financial crisis fast food traffic held relatively steady compared to the rest of retail. The lowest 75% of incomes did not change their spending at QSRs at a statistically significant level with most trading down occurring by replacing full-service restaurants with food at home. Papa Johns has historically noted that during recessions volumes increase, thanks to the high-margin nature of pizza allowing for higher levels of discounting and cost absorption.
The largest concern in an economic contraction with rising prices is the ability for a firm to pass on costs to consumers. Pizza is a relatively high margin item, which should allow for larger absorption instead of needing to pass on all costs to consumers. Papa Johns and the pizza QSR market began a massive campaign of discounting starting in 2008, coming to a head in 2010. While this compressed margins, it was at least partially offset by the subsequent increase in traffic. We believe a reasonable impact to discounting is a 150bps decrease to operating margin offset by a boost to volumes.
The USDA notes a substantial increase in the price sensitivity of consumers during economic downturn. During 2022, Papa Johns was able to pass on much of the inflationary cost increases to consumers across its menu. However, a year later, it saw sales declines as it heavily shifted marketing to its premium offerings to make up for the now comparably low-margin value items. Since management has commented that their ability to pass on all commodity or inflationary impacts to consumers would be limited in an economic downturn, we believe it is more likely than not that they will absorb a solid portion of the cost as they did during the 2008 financial crisis.
While we think we are in uncharted territory given the impact of tariffs, much of the dairy, wheat, and other inputs to pizza are domestically sourced, thus we do not expect substantial pricing pressure for a bulk-purchaser like Papa Johns. The largest impact will be tomatoes. From July 14, 2025 the United States will begin to levy a 20.9% duty on Mexican tomatoes. Most estimates put 60% of tomatoes consumed within the US as originating from Mexico. While Papa Johns does not disclose specific suppliers, management notes specific risks from the California tomato crop which we interpret as Papa Johns sourcing much of the tomatoes domestically as well. Irrespective of Papa Johns specific source though, domestic prices will rise due to the shift to domestic sourcing, albeit not as high as 20.9%. Specific impacts to the bottom line are likely to be around 300bps or less, though the length of time the tariffs are in place will also have substantial impacts.
Operations
Globally, Papa Johns operates 6,030 restaurants with 9.2% being corporate owned. Revenues from restaurant operations were down 3.6% year over year, largely due to shifting the strategy toward emphasizing value offerings. For the full year 2024, excluding the impact of the extra week this fiscal year, total revenues were flat overall. Store-level operating margin (excluding gains from sales of stores and refranchising costs) for corporate owned stores in North America was 3.6%, with domestic franchises coming in at 9.2% and international operations reporting 9.3%. Companywide, operating margins for 2024 were 9.5%, a 210bps increase.
For the first 8 weeks of 2025, management reported that it had per-customer ticket size down 2.5% year over year, with volumes only down 0.5% year over year. Largely, the per-customer decrease in ticket size was due to the revamp of the rewards program and orienting toward value-offerings.
| Type | Number | Revenue from Operations and Commissary ($ millions) | % of Total | Change from 2023 |
| Company-Owned North America | 539 | $692,736 | 34.3% | -4.6% |
| Company-Owned International | 13 | $31,930 | 1.6% | -7.3% |
| Company-Owned Total | 552 | $724,666 | 35.9% | -4.8% |
| Franchised North America | 2,975 | $1,180,249 | 58.4% | -2.6% |
| Franchised International | 2,503 | $115,831 | 5.7% | -5.6% |
| Franchised Total | 5,478 | $1,296,080 | 64.1% | -2.9% |
| Total | 6,030 | $2,020,746 | -3.6% |
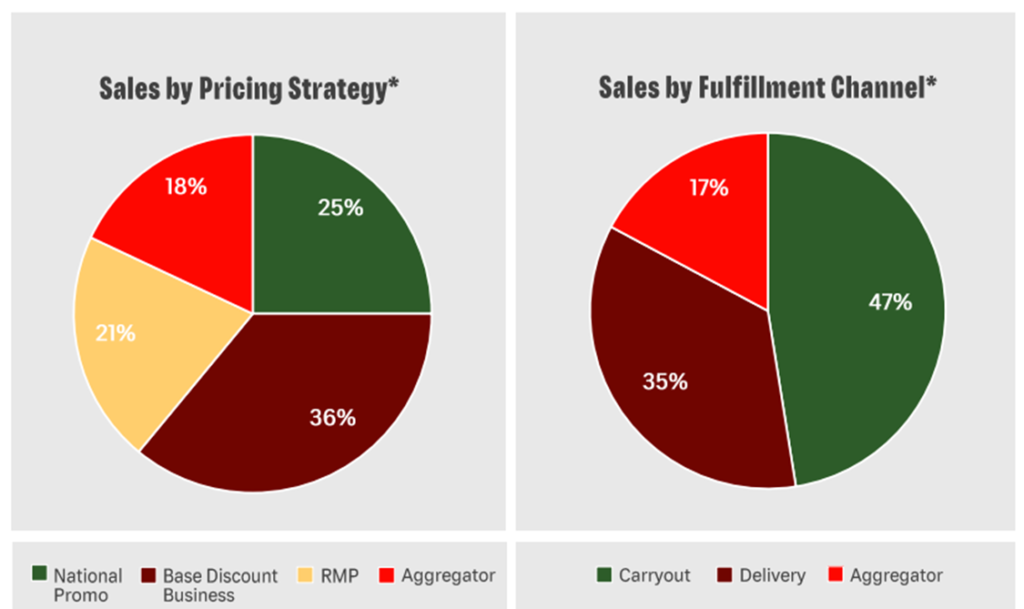
On a more granular level, management stated the first 8 weeks of 2025 had aggregator apps up an undisclosed amount, carry-out up low single digits, though both were not enough to offset the loss in first-party delivery traffic. Papa Johns has identified carry-out as a major growth avenue in a down economic environment and has stated that its biggest positive impact from marketing investments have been in carry-out. We expect that 2025 will see carryout increase as a percentage of fulfillment channel, though over time we expect more advertising and incentive dollars to go toward trying to take fulfillment share from aggregators back to first party delivery. While aggregator’s are reported to be more margin accretive than first-party delivery, the consumer relationships through first-party delivery are valuable for retention and order frequency.
Currently Papa Johns has 35 million loyalty members, with 50% of them being considered active users, up from 21% last year. During November 2024 Papa Johns changed its loyalty scheme to points rather than a “buy x get 1 free” scheme, which has increased order volumes, and now 70% of all transactions result in some loyalty benefit to customers. Management has stated it will continue to see some margin compression through the middle of the year as a result of the promo changeover, though it will likely assist with boosting volumes over the same time frame.
Unit Economics
Unit economics across franchises in 2024 remained strong. The largest difference between restaurants is volume rather than margin, with the top quartile having nearly identical margin per ticket as the bottom quartile.
| Metric | Franchised Domestic North America |
| Annual Unit Sales | $1.1 million |
| Orders per Week | 800 |
| Order Size | $27.03 |
| Margin per Order | $19.43 |
| Restaurant-level EBITA Margin (including royalties) | 12.0% |
| Payback Period | 3.2 Years |
Like other franchises, Papa Johns typically receives a 5% of sales royalty from the franchisee, along with an 8% advertising fee over a 10-year contract length with another 10-year option for renewal. Internationally in certain operating areas like China, it licenses full master franchise rights, allowing sub-franchising and more local control over operations. Typically, the master franchisee pays Papa Johns a 3% of sales royalty from all locations, with the master franchisee allowed to set their own royalty structure for sub-franchises. Additionally, franchisees must purchase pizza sauce, dough, paper products, smallware’s, cleaning supplies and other daily running items from Papa Johns owned commissary services, which have a fixed markup above cost.
As of the end of 2023, the markup charged to franchisees was 4%. During 2024, US commissary markups increased to 5% with management stating it plans to ramp by 100bps per year until it hits 8% by 2028. To help offset increases on franchisees Papa Johns has introduced an incentive structure to high-performing stores, offering discounts based on volumes, and rebates for opening new restaurants. According to management, high performance franchisees will see their markups go below the pre-2024 4% figure.
Expansion
Based on a 2022 Bloomberg report, Papa Johns held around 22% of domestic US market share. We believe that this figure is low compared to the current market, with management commenting that it has made progress on taking market share and will prioritize gaining market share momentum through building out its footprint in ‘priority markets’.
During 2024, Papa Johns opened 198 restaurants internationally and 112 domestically, or about a 2.0% growth in footprint size. We expect a similar figure for 2025 even in the event of an economic downturn as the latest expansion effort is focused on high-unit volume areas and taking market share.
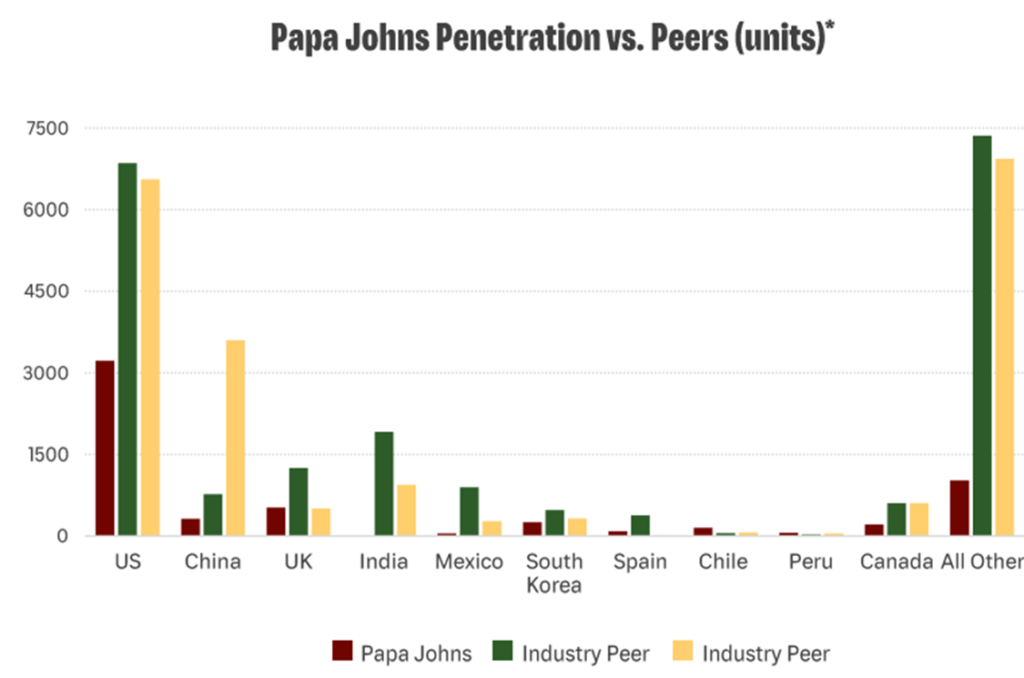
Despite having similar brand recognition as peers like Pizza Hut and Dominoes, Papa Johns still trails peers in penetration even in markets it is competitive in, such as the US and Canada.
We believe it is important to highlight that the per-store opening cost has decreased by 25% to just $515,000 in 2024, targeting a further 3% decrease in 2025. The majority portion of these savings has come from waiving the requirement for advertising pool contribution for the first 5-years for 2024 and the first 3-years in 2025. While the bottom-line impact to Papa Johns is likely to be net negative considering the additional ad spend not covered by franchisees, we believe that this enhances the value proposition of becoming a Papa Johns franchisee. The payback period on a Papa Johns location has decreased from approximately 5.5 years to just 3.2 years, bringing it more in line with high-value brands like McDonalds and even exceeding peers like Pizza Hut and Dominoes.
Papa Johns appears to be encouraging its largest franchise partners to expand its footprint either through selling them successful company-owned stores in their operating area, or incentives such as discounts on commissary as previously discussed. According to the Investor Day materials, the top 25 franchisees have over 50% of revenues, with an average store count per franchisee being 7.3. Many of the top-franchises also have development agreements, typically structured as the franchisee committing to a certain number of openings in a geographic area in a limited time frame, and paying an extra fee in exchange for exclusivity in a geographic area.
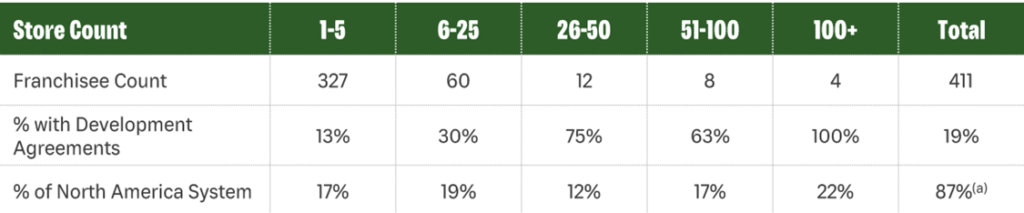
We believe that this concentration is an advantage rather than a liability, as it ties the most successful operators to the success of the brand as a whole. Additionally, as was the case for 15 restaurants in Wisconsin and 61 international restaurants in 2024, it allows an offramp for Papa Johns to divest company-owned stores to partners with more regional expertise.
Outside of the US, Papa Johns continues to refocus its international footprint. First announced in 2023, the ‘international transformation’ plan is designed to bring the international costs in-line with domestic and divest most of the company-owned restaurants to regional operators.
In the United Kingdom the most aggressive of these actions took place during 2024, with Papa Johns closing 43 company restaurants, refranchising 60 company restaurants, and terminating 30 franchised locations. Based on management’s commentary we believe that they are largely finished with closure actions in the UK and the remaining actions will be focused on positioning franchisees for growth.
Over the long-term, management highlighted that it is seeking to enter India and Saudi Arabia over the medium term, to grow its footprint in Korea and Spain, and engage in actions in China like the UK of closing underperforming stores and refranchising others. While there is no specific timeline, regional offices in these areas have opened to act as more localized support for expansion.
Risk
Despite owned stores only making up 9.2% of the footprint, they represent 35.9% of restaurant revenues. Unlike mostly franchised peers like Pizza Hut, Papa Johns profitability is more exposed to risks associated with commodities and consumer behavior. While QSRs typically hold up in past recessionary environments, consumers are now able to shop a deal through aggregator apps rather than relying on a limited number of delivery and takeout options as has historically been the case.
As previously discussed, we believe the overall impact of tariffs will be minimal on Papa Johns directly though domestic prices will likely increase as competitors begin to switch sources. Currently, Papa Johns only expects commodity inflation to be around 2% for 2025. While we consider an environment with high commodity inflation, high unemployment and low growth to be an absolute worst case, that remains unlikely to occur, we believe Papa Johns would be able to absorb a significant amount of cost before passing it onto consumers given the focus on volume and value, and that unit-economics would recover relatively quickly.
Financials and Outlook
For 2025, Papa Johns expects 2-5% sales growth globally, with 0-2% in the US. Due to the previously discussed loyalty enhancements and value targeting, operating margins are expected to be compressed in the first quarter, transitioning to flat through the midyear, and possibly up marginally in the final quarter. Toward the back half the year, we expect that some lower margin menu-removals will be executed to simplify the supply chain and drive more customers toward high-margin items that are still under the value category. Management expects EBITDA (less stock comp) to be $200-220 million, 7.5% year over year decline at the midpoint. In our view, this is not concerning given management’s detailed disclosure of specific areas where they are sacrificing short-term margin for long-term incremental gains and continued capex spending despite the uncertain economic environment.
Advertising spend is undergoing a change in strategy, with management stating it is a “game that is played nationally but won locally”. Papa Johns corporate are engaging with top franchisee partners to test marketing messages to determine how to win customers in a ‘value-focused environment’. We expect this will include a shift toward value-oriented deals in the loyalty program and in-app. Overall, Papa Johns is guiding toward $20 million in additional marketing and $5 million in promotional spend.
During 2025, Papa Johns expects capex to be between $75-85 million, which is a slight increase compared to 2024. We expect a similar priority to 2024 with opening of restaurants and encouraging growth to be the biggest usage.
We believe the increase in capex is due to focused investments on the tech stack. Papa Johns is a sector leader in technology order penetration, with 85% of domestic sales originating through aggregator or its own app/website as opposed to direct foot traffic or phone calls. On April 3rd, Papa Johns announced it was partnering with Google Cloud to introduce machine learning onto customer analytics to provide tailored deals for customers. For competitors like Uber Eats such innovations have increased repeat order volume and increased per-customer spend with tailored discounts. While specific bottom line impacts are likely to be minimal over the medium term in our view, it does demonstrate that management is ready to be ahead of the innovation curve.
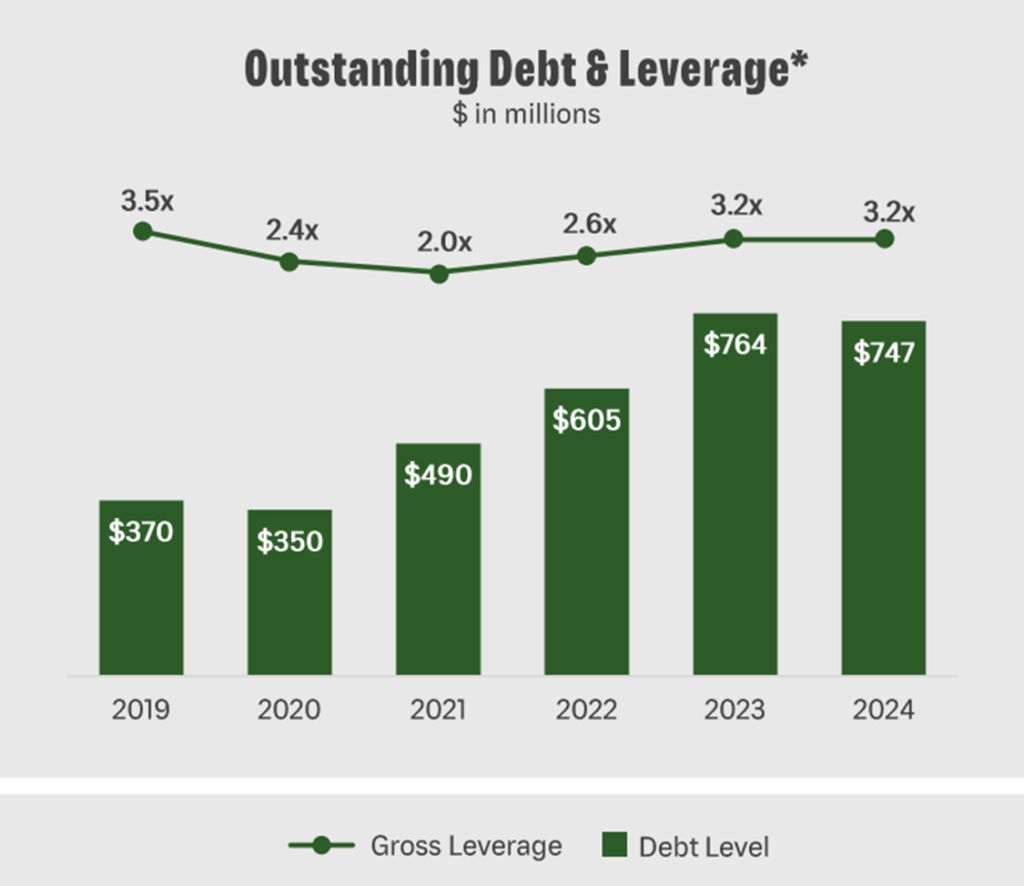
Currently Papa Johns has a gross leverage of 3.2x, and an interest coverage ratio of 3.2x. For its debt covenants, Papa Johns cannot exceed 5.25x for gross leverage and may not drop below 2.0x for interest coverage. During 2025 interest costs are expected to be $40-45 million, flat year over year. Papa Johns ended 2024 with a cash position of $38 million and generated $34.1 million in free cash.
Currently Papa Johns pays out a 5.93% yield or $1.84 annually. Papa John’s last raised its dividend in 2023, and we do not expect a meaningful increase to the dividend during 2025. Additionally, we do not expect meaningful share repurchase actions during the year given the priority on growth and strengthening the balance sheet.
Conclusion
While short-term margins will remain compressed, we believe that Papa Johns is setting up to be a market share taker over the medium-term. Thanks to volume and loyalty-based incentives for customers and franchisees we believe that the short-term loss in margin will yield meaningful structural improvements over the long-term. While we do not expect buybacks, the 5.9% dividend yield provides income through the downcycle and thus we believe Papa Johns is a good addition to a defensive income portfolio.
Peer Comparisons