Gold’s Resurgence in a De-Dollarizing World
| August 22, 2023 |
- China/BRICS is actively working to reduce global trade’s dependency on the US Dollar, settling international agreements in their currency, the RMB.
- The US faces numerous economic problems, from the credit rating downgrade to ballooning debt and an aging population.
- Central banks have significantly increased their gold purchases, with a 152% year-over-year increase in 2022, primarily driven by countries like China and Russia seeking to move away from the US dollar.
- Gold has been a historically stable value asset, now being one of the only options now that Treasuries are falling out of favor internationally hinting at its potential to reach unprecedented price levels.
Brief History of Modern Gold
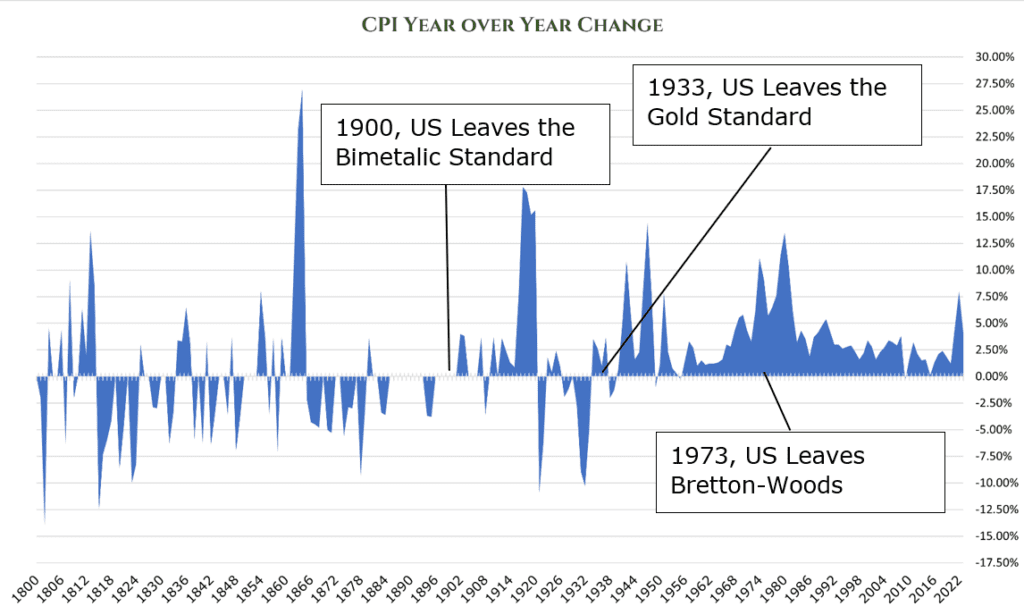
In 1971, Richard Nixon suspended the US Dollars ability to be exchanged 1:1 with equal value in Gold. The previous decade had begun to be burdened by high government spending from both the Vietnam War and a new slew of social programs.
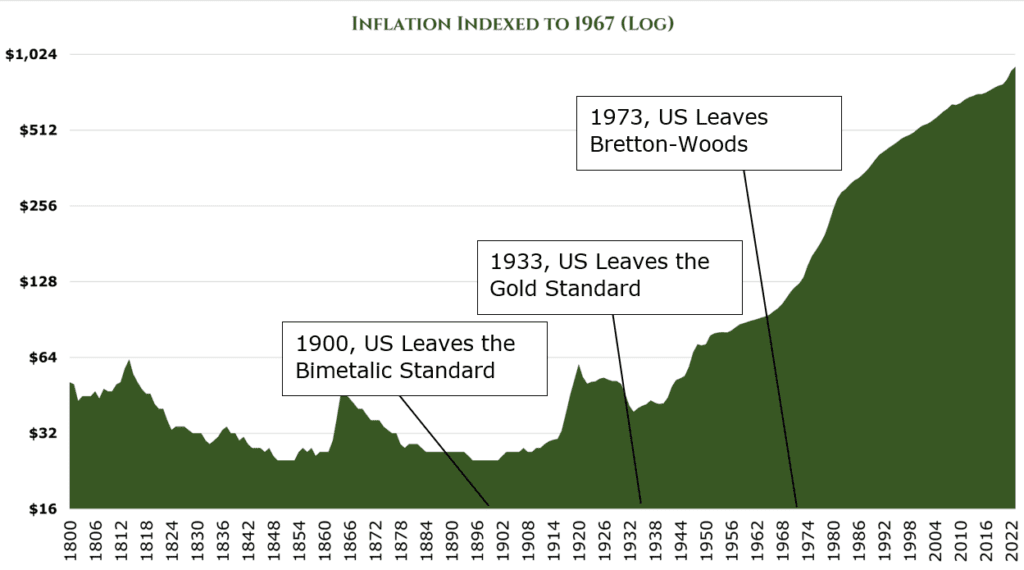
This caused uncertainty in the ability of the US to continue paying its debts in cash amid growing fears of stagflation. Many foreign banks began to exchange their dollar reserves for Gold direct from the Treasury. This further strained the US economy, with the Treasury unable to keep Gold at its stable price target.
A significant set of challenges arose in the following decades:
- Without Gold backing constraining the issuing of new notes governments could print excessive amounts of money, leading to inflation.
- Under the gold standard, trade was self-correcting. Over the long term, trade deficits would cause central banks to sell Gold, limiting domestic monetary supply. This would lead to domestic deflation, making a country’s goods more valuable in the international market.
- For nations with strong currencies, particularly those with reserve status, there is little consequence for running deficits over the short term. Additionally, those strong-currency nations have a significant impact on global financial conditions. This can easily trample developing economies in times of global crisis.
De-Dollarization on the Horizon
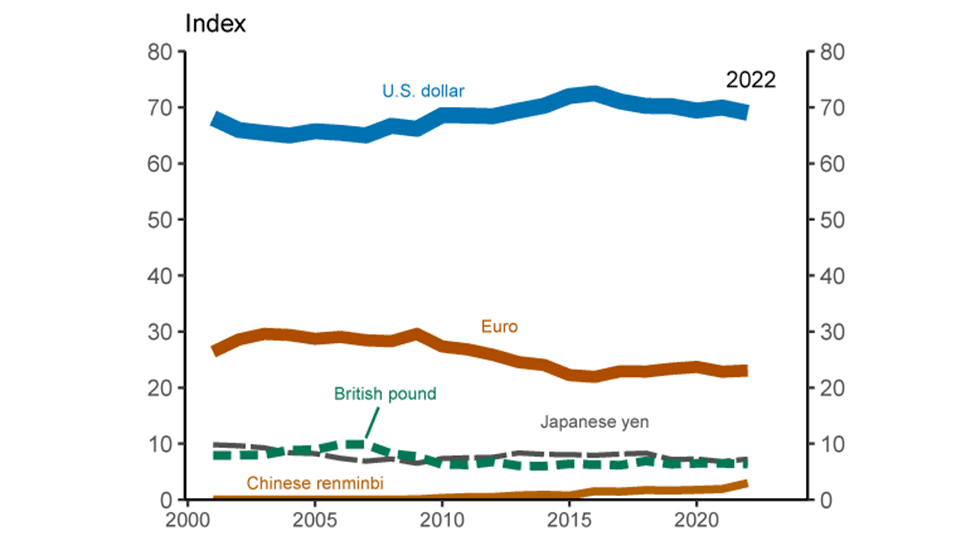
China has been pushing to reduce the amount of global trade settled in the US Dollar. China has been settling numerous international trade agreements with developing nations in their domestic Yuan/Renminbi (Often annotated as CNY or RMB). For the first time in July, China used their native RMB more than the USD for cross-border transactions. While the RMB still makes up a relatively small portion (2.77%) of global cross-border transactions utilizing SWIFT, it is still a 180bps increase compared to 5 years ago. This is largely due to circumventing Russian sanctions, with some 39% of the total volume in Russia’s forex markets being RUB/RMB pairings. China and Brazil have reached a recent agreement to settle trade in RMB, and Argentina stated they would also switch to settling trade with China in RMB. Saudi Aramco telegraphed its interest in selling oil to China via the RMB. Even France, where TotalEnergies (EPA:TTE) purchased NGLs in RMB for the first time.
While this may typically affect forex markets, China’s economy is still struggling to recover from COVID-19. Economic recovery in China has continuously undershot expectations, and significant currency controls imposed on the RMB make it unattractive as a long-term store of value. This adds additional upward pressure on Gold as the de-politicized store of value.
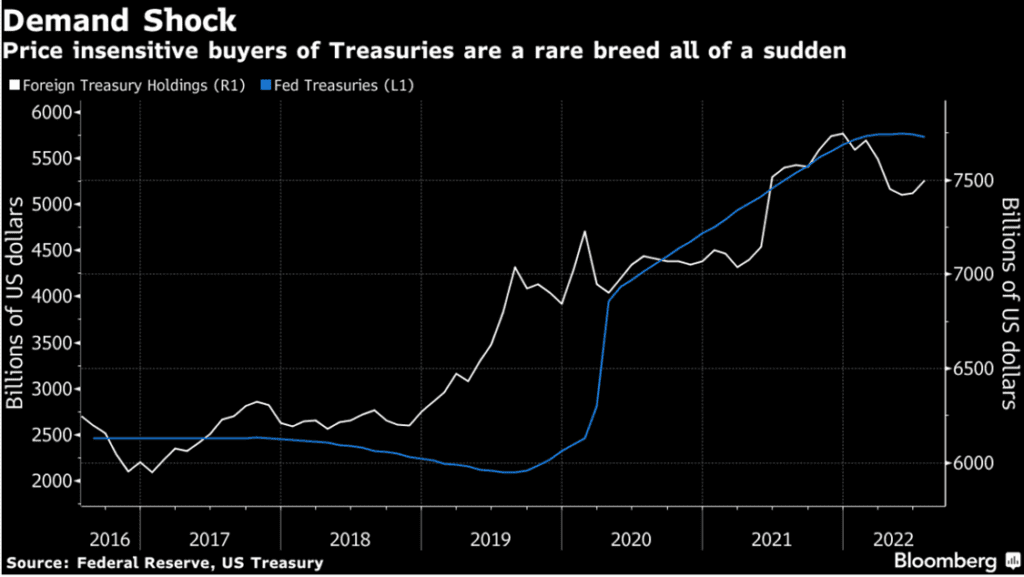
The Fed’s aggressive tightening after years of QE has had unintentional effects in the developing world. Nearly every currency in the developing world has heavily devalued against the USD. Many developing economies put 60% of their reserves into the USD through Treasury bonds – typically, they are price-insensitive buyers. However, the demand in the developing world has dried up, representing over $300 billion.
All of this comes with a renewed push for integrating BRICS. BRICS is a term first coined by Goldman Sachs economist in 2001 to describe, in short, developing economies that could overtake the “western world” economically by 2050. The countries described in the original report, Brazil, Russia, India, and China made the association of BRIC formal in 2006 and invited South Africa in 2010. The stated goal of the first summit in 2009 was not only a political and trading bloc (which largely failed to materialize) but rather an agreement that there needed to be a new global reserve currency.
The strongest thing BRICS countries share is the desire for an economy not accountable to the US Dollar. This greatly appeals to developing economies heavily reliant on imports from Russia or China. When the USD is strong, countries settling in USD lose money on trade as they mutually exchange their currencies to and from USD. Experts dispute how politically successful BRICS will ever be, but 40 countries, 40% of the world population and 25% of its GDP, are seeking to join the bloc, and that cannot be ignored.
Internal Issues, Compounding Problems
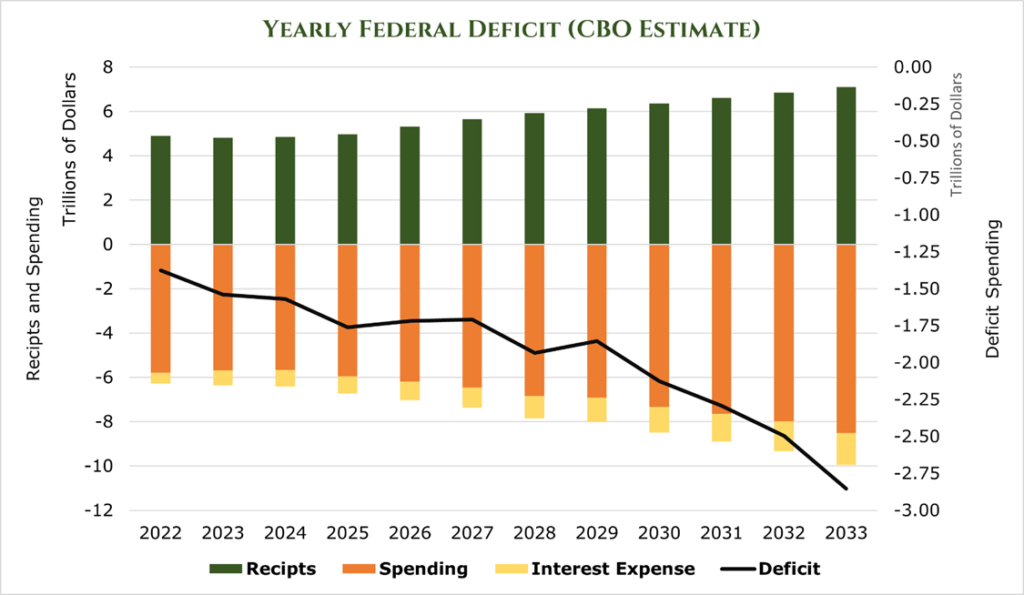
Fitch has downgraded the US in the face of expected recession and the reduction of long-term fiscal thinking in favor of “last minute resolutions.” AA+ is still a good rating, and it’s unlikely that credit risk will materialize but it does highlight the possibility of debt monetization. The US Government’s largest risks are inflation and interest rate risks. The deficit will run approximately $1.6 trillion in FY23 and is projected to grow to $2.75 Trillion per year in 2033. Even with the most optimistic estimates, the US will reach $55 trillion in debt in FY33.
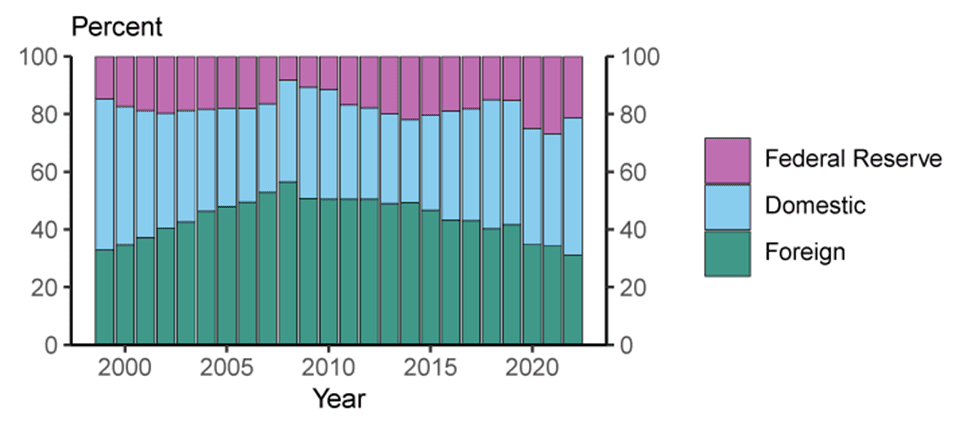
This debt has been largely financed in recent years by the Federal Reserve, which has grown its balance sheet from $800 billion in 2008 to almost $9 trillion in 2022. The Fed has started reducing its balance sheet, projecting a $1 Trillion yearly sell-off. The Fed has represented almost 20% of yearly purchases of Treasuries, and with foreign central banks also selling US Treasuries, it leaves very few price and yield-insensitive buyers.
Baby Boomers will keep aging and become net payees rather than net payors in taxes. By 2033 the CBO estimates that approximately 73 million Americans will be of retirement age. Social Security and Medicare spending will grow by $2 Trillion per year to reach just over $4 Trillion.

Compounding all this is the massive increase in interest rates. With the Fed’s Treasury purchases over the last 15 years with depressing interest rates, the massive debt load it helped create will almost certainly compound upon itself. The annualized cost of servicing this debt accounts for 14% of total federal spending and will breach $1 Trillion per year in servicing costs by 2030.
Unfortunately, there is no clear way forward. The CBO reported in 2010 several key issues that the government would face if the path of deficit spending and Treasury issuance continued:
Crowding out of private investment at best and a credit crunch at worst, with consumers and banks still purchasing Treasuries demanding higher rates of return. The CBO stated that this would cause “productive capital” investment to shrink, reducing GDP growth and much higher interest rates.
Cutting services is deeply unpopular, and increasing taxes would impede Americans’ ability to save. An additional knock-on effect of increasing taxes is reducing working and saving, which would reduce GDP growth.
Policymakers would be functionally unable to respond to crises with fiscal policy. The United States has engaged in massive relief programs following COVID-19 and the massively expensive Global War on Terror. Flexibility in fiscal policy allows for stimulating the economy in crisis, better national security preparation, and recognized stability. With the high debt level, responding to the next crisis may become nigh impossible.
Finally, debt creates a situation in which fiscal crises are more frequent, more sudden, and larger in magnitude. As previously stated, private investors potentially demand higher interest rates for government debt.
2023 is seeing a Surge in Gold Purchasing from Central Banks
In 2022 all central banks bought 1,136 metric tons of Gold, or around $70 billion. Experts believe that much of this is from China and Russia (roughly 800 metric tons), who want to de-dollarize the developing world to circumvent sanctions.
Additionally, many previously discussed developing nations are utilizing more Gold and less Treasuries as a safe haven asset. Gold provides a stable store of value and has high liquidity even during economic uncertainty. While currencies can be devalued by policy or inflation, Gold has intrinsic value and has historically maintained its purchasing power.
| Demand | FY22 | FY21 | Change (year over year%) |
| Jewelry | 2,109.8 | 2,230.6 | -2% |
| Technology | 308.5 | 330.2 | -7% |
| Investment (Non-government) | 1,106.8 | 1,001.9 | 10% |
| Central Banks | 1,135.7 | 450 | 152% |
| Aggregate Gold Demand | 4740.7 | 4,012.8 | 18% |
Investment Thesis
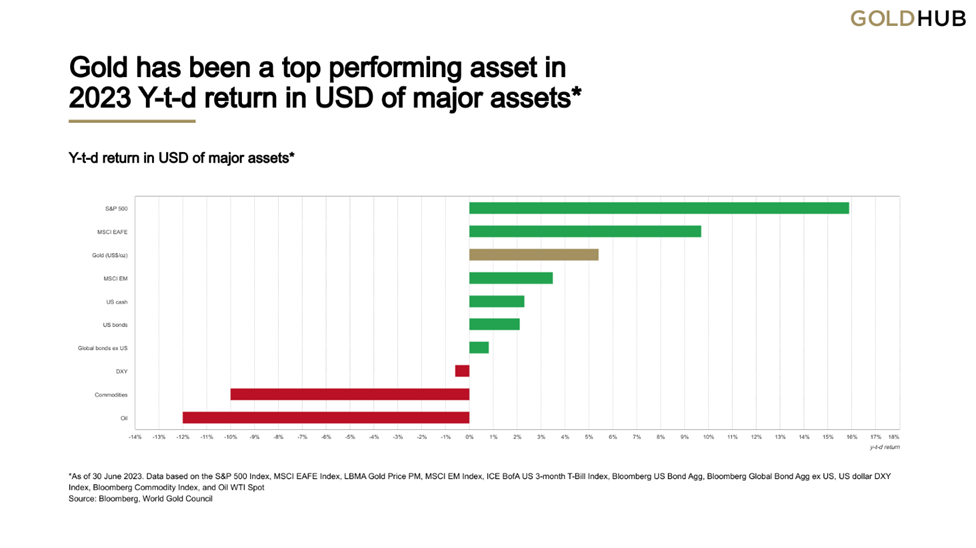
Historically Gold has been the global standard for a safe store of value, and with the growing sentiment of de-dollarization among investors and the developing world, predicted economic contraction, and the US debt downgrade, it may find itself in a situation with significant upward pressure once again. Relative to other commodities and currencies, Gold is a real value store. Gold has a very low elasticity of supply, meaning that it is difficult to increase the supply of Gold like OPEC can oil suddenly.
Gold is a finite resource and a historically solid hedge against inflation. It holds high intrinsic value across economies and cultures. The current global situation is uncertain, but Gold has a strong potential to surpass its all-time high price of $2074.88/oz.
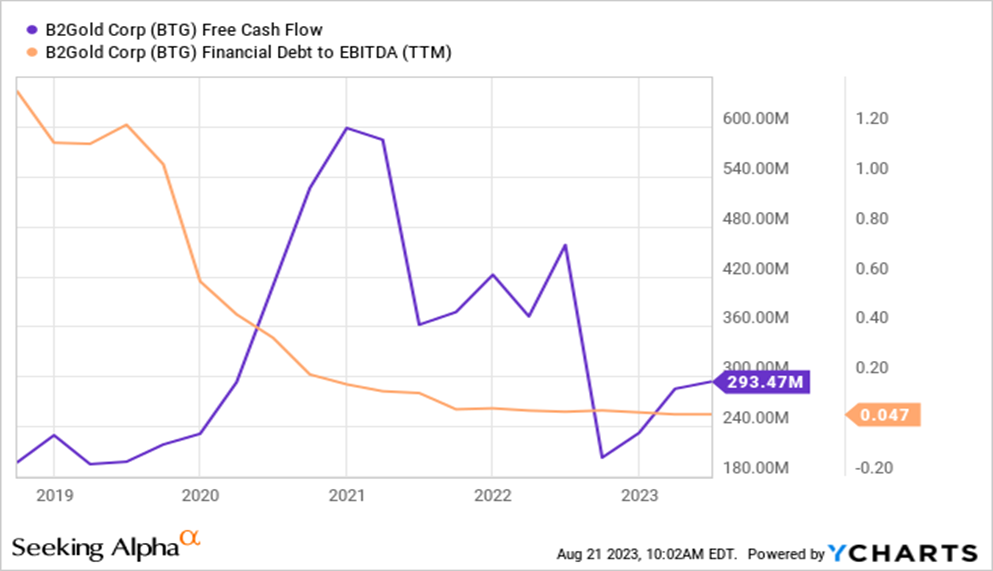
Buy2Gold (BTG) – Cash-Rich Expansion into Greenfield Areas
Buy2Gold (BTG) is a globalized gold-mining company, operating several low-cost mines and several exploratory digs on almost every continent. BTG has a strong liquidity position with $674 million in cash on hand and no net debt. BTG expects to output 1,000koz in FY23, averaging an AISC of $1195-$1255/oz.
This cash on hand is to be used for expansion and dividends, which currently yield 4.1%. BTG has stated that it will utilize its free cash position for expansion and development, a path they intend to continue. Expansion projects include a new mine and milling facility in Nunavut, Canada with 6,321koz of Gold in indicated and measured resource estimates. First milling production is expected to be online in 1Q25. Grassroots projects include A JV in Finland with Aurion Resources and a borehole project in the Ivory Coast on existing BTG land.
The main risk facing BTG at the present moment is the ongoing coup and ECOWAS response in Niger. The Malian government has thrown its weight behind the Niger Junta, joining Burkina Faso. The Fekola mine in Mali makes up 58% of BTG production, and closure of the mine, even for a short term amid ongoing conflict, would be devastating for BTG’s production. ECOWAS has previously sanctioned Mali, but BTG claimed no impact to production due to this. BTG is a cash-rich power player in the low AISC mining world and still maintains an attractive valuation.
Newmont Corporation (NEM) – Expanding into Copper from a Mature Position in Gold
Newmont Corporation (NEM) is the #1 gold producer globally, outputting 6Moz of Gold per year, 35Moz of silver, and various other byproduct metals, including zinc and lead. Gold production is expected to remain at 6-7Moz until after 2032, making NEM one of the longest production profiles in the industry.
Expansion is still strong with this mature mining operation, with 9 feasibility studies ongoing for expansion within the next decade. Largely, in the short term, NEM will continue to focus on Gold. However, many of the projects in the latter half of the decade have significant deposits of copper. NEM acquired Newcrest in May of FY23, expecting the transaction to close in 4Q23. Newcrest is located in the same geographic areas that Nem already operates in, but is focused on copper mining. This will double NEM’s copper footprint and add $500 million in savings annually after FY25.
Compared to its competitors, NEM operates in more politically stable locations, with main production assets located in Canada and Australia. Additionally, NEM is well-regarded as having high-quality governance.
Management is embarking on a streamlining campaign to reduce costs and overheads. It is expected to yield $440 million in savings in FY23, with $2 billion in targeted savings by FY25 (including acquisitions). With $3.5 billion in cash on hand and 0.6x debt to EBITDA, NEM is in a very safe position in the gold sector. For every $100/oz gold increase, NEM adds $400 million per year in free cash flow. If Gold breaches $2000/oz, this could mean $2.4 billion in additional yearly free cash flow. Currently, NEM targets a 3% dividend yield.
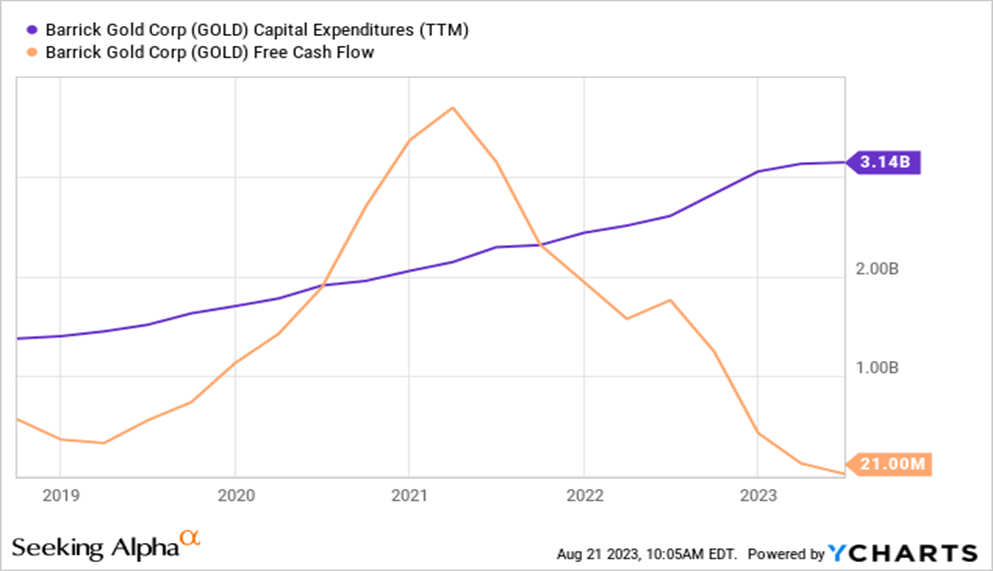
Barrick Gold (GOLD) – Fortress Balance Sheet, Expanding in Copper
Barrick Gold (GOLD) is a gold and copper producer operating primarily in North America and Africa. Barrick has 4.4Moz of Gold per year in output, with significant expansion into copper. All in sustaining costs are $1300/oz for Gold and $3.13/lb for copper. Management is targeting a 25% growth in gold equivalent ounce output by the end of the decade.
Barrick has the highest credit rating in the gold mining sector at A3. The largest expansion opportunities are in Latin America where Barrick is investing heavily in finding its next tier 1 operation and expanding the efficiency and output of existing operations. Additionally, Barrick expects to reduce all-in sustaining cost average as expansion into cheaper mines begins to show output in FY24.
Barrick is currently experiencing weakness after its results have been poorer than expected. However, the pieces for a great value based investment are there with margin expansion and cost reduction on the horizon.
Gold Fields International (GFI) – Long Delays Finally Over
Gold Fields International (GFI) is a south African gold mining company, with 2.3Moz in Gold equivalent production per year, and a $1300/oz in AISC. GFI has experienced significant headwinds in FY22 and 1H23. The debt remains low at 0.42x debt to EBITDA. Their $482 million free cash flow also goes toward significant development expansion projects and a 4.2% dividend yield.
Salares Norte is the largest fully owned development asset and will enter its first production in 4Q23. Thus far, the project has cost $881 million and is expected to output an average of 450koz of Gold per year for the first 7 years, expecting an AISC of only $465/oz. This would make Salares Norte one of the cheapest gold mining operations in the world and add significant margin expansion to GFI’s South American operations.
GFI has a significant low-cost expansion opportunity with the Salares Norte Project, and has recently entered an exploration JV in Canada for $200 million. While replacing used assets and acquisitions has slowed down in recent years, GFI still has a solid free cash base and a low debt level that would allow it to expand once capital-intensive projects like Salares Norte are complete.
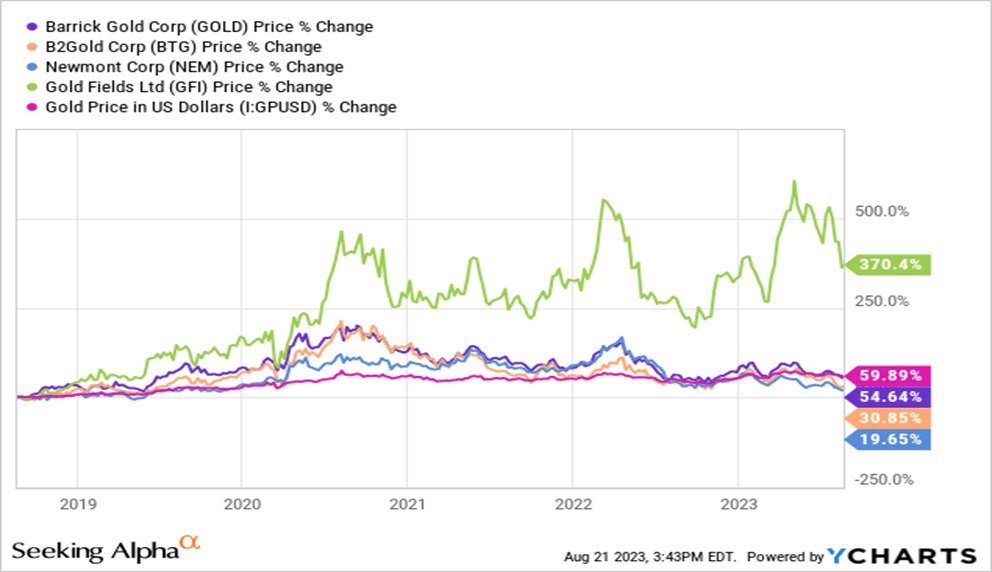
Competitive Comparisons