Financially Stretched Consumers Set to Cut Back Spending
| November 29, 2023 |
- We are avoiding retail stocks like Amazon (AMZN), Target (TGT), Lowe’s (LOW) and Wayfair (W).
Also avoiding consumer discretionary stocks like Tesla (TSLA), Carvana (CVNA) and consumer finance stocks like Capital One (COF), Discover (DFS) and Affirm (AFRM). - Over 51% of Americans now carry a balance on their credit cards each month, a 27% increase since 2018.
- As of October, 28.9% of banks reported tightening standards for consumer lending, a leading indicator of potential recession.
- Delinquency rates across all non-mortgages have surpassed pre-pandemic levels, with a sharp increase observed in the September quarter, particularly among younger consumers.
- Student loan pause added $260 billion in consumption, accounting for up to 0.8% of monthly consumer spending. The pause ended on September 1.
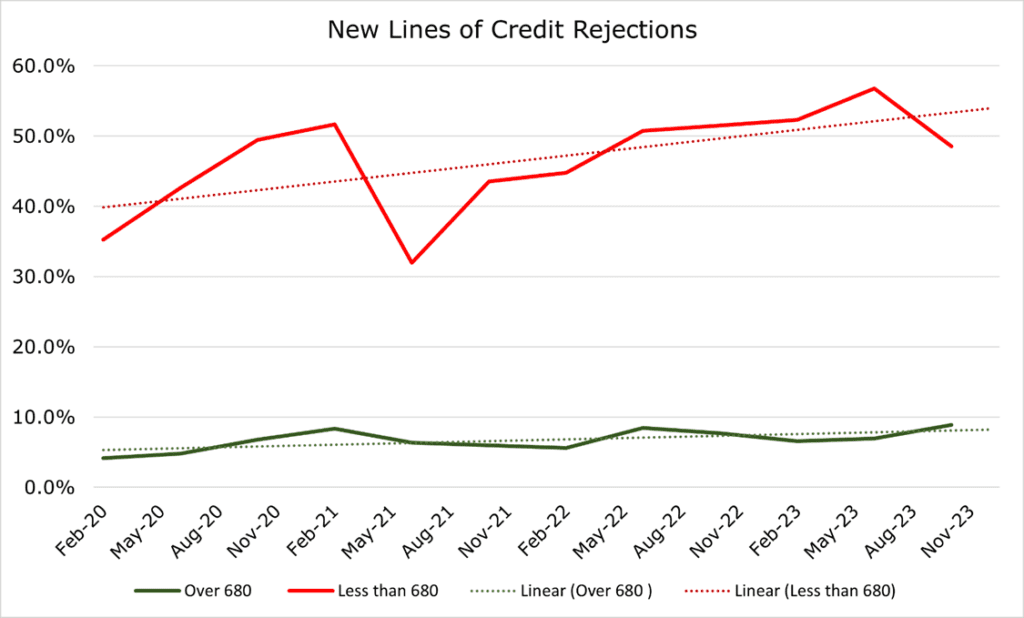
- The average interest rate on credit cards has soared to 20.72%, with rejections for scores under 700 hitting over 50%.
Investment Thesis
Consumer spending, the driving force behind 66% of U.S. GDP, is showing its shaky foundation. Retail discounting is above average, with reductions reaching 24% with 8% of items on discount. This signals that companies are bracing for a potential downturn in the hot consumer-spending area over the holiday season, trying to offload excess inventory or stimulate impulse purchases.

Between rising delinquencies across all types of credit, record credit card balances, resumption of student loan payments putting more pressure on consumers, and a significant drawdown of savings below pre-pandemic trends, we are avoiding consumer discretionary companies, especially retail.
Real Wages Not Keeping Up with Expenses or Spending
While average wage growth since 2019 has finally surpassed inflation, it will take until the end of 2024 for the gap between wages and inflation to close. The gap is far more obvious on an after tax income level, with consumption staying elevated despite a serious drop below the pre-pandemic trend.
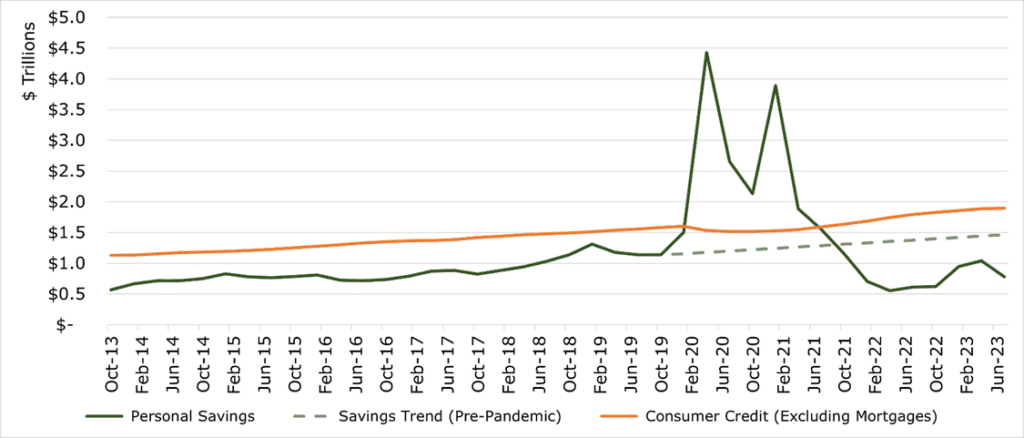
One would expect these lines to be in tandem, and in other developed benchmark economies, they are. The disparity between actual spending and available income has been bridged through the depletion of savings and credit utilization
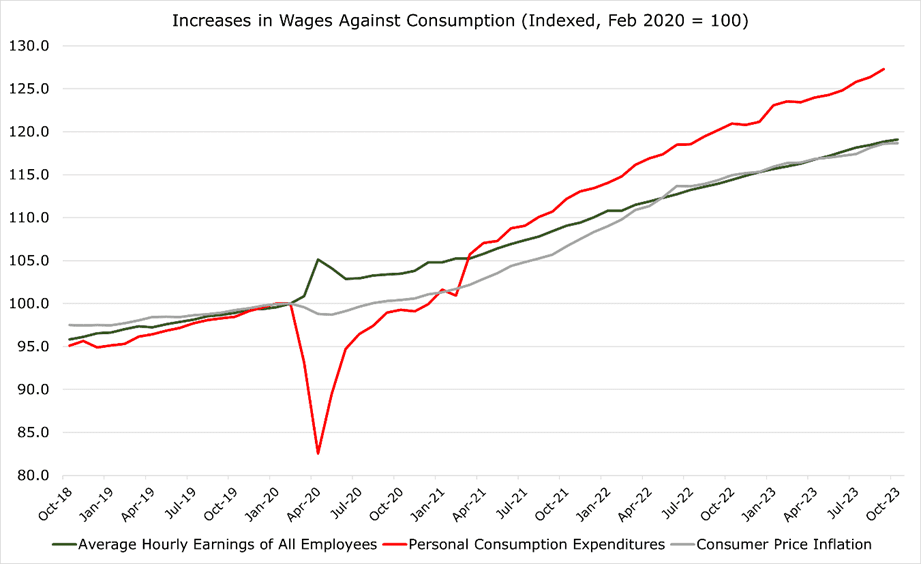
Had the U.S. savings rates stayed consistent with their pre-pandemic trend real consumption and disposable income would have aligned closely. In other words, if U.S. consumers hadn’t drawn down their savings and begun utilizing credit, real GDP growth would currently be 2% lower than it was reported at in the September quarter.
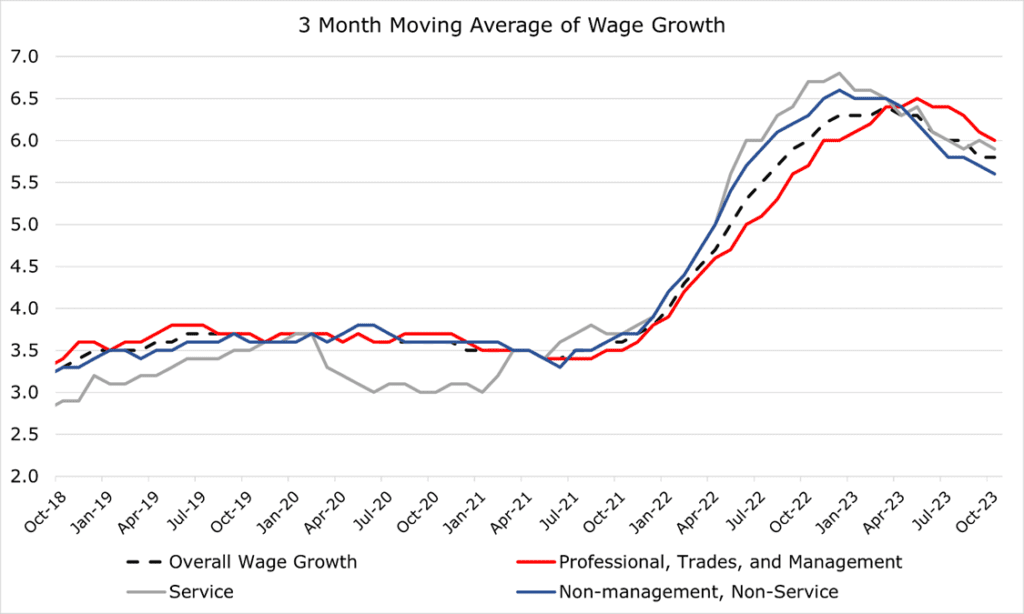
Much of the wage gains realized due to the pandemic and labor shortage were workers previously in service and retail professions. These professions saw sharper, and faster responses to the labor shortage than other professions.
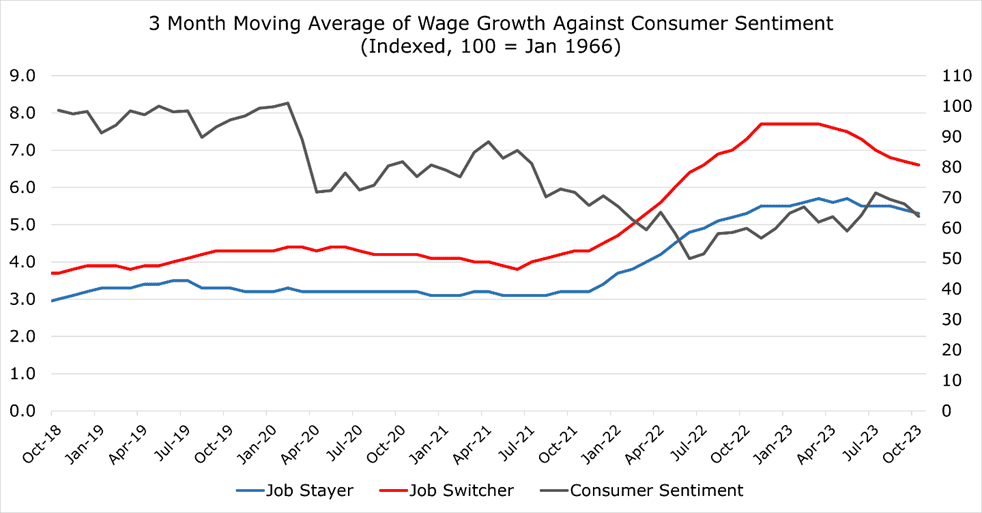
Additionally, the labor shortage punished those who stayed at their jobs rather than switching. Wage growth for “job stayers,” significantly lagged those who switched. This can in-part explain the low consumer confidence in the United States, which has struggled to return to normal levels even in the face of improving economic data. Those whose situation did not meaningfully change through the pandemic find themselves worse off.
The Permanent Income Hypothesis states that consumers maintain consistent spending patterns even when their real income declines, causing them to rely on credit or savings to bridge the gap. While this could normally be temporary, called consumption smoothing, consumers are anchoring their expectations to April of 2020 when stimulus money flowed freely, and credit was easy to come by. As this behavior ceases, it could pose serious challenges to retail stock margins and inventory levels.
Potential Explanations Do Not Do Enough
Numerous explanations have been put forward for the reasoning behind real wage declines. A potential one is the expiration of the Child Tax Credit, which caused a 2-3% drop in nominal income in qualifying individuals due to tax increases that counteracted real wage rises. However, this tax credit only applies to families with qualifying dependent children and thus only about 40% of Americans have any form of exposure.
The second common explanation is that Medicaid’s continuous enrollment provision expired in March of 2023, a program that paused eligibility redeterminations for the duration of the pandemic. This means that Medicaid still covered people who no longer qualified due to wage increases and thus did not have to seek private insurance. A key problem with this theory is that, across all states, 71% of those disenrolled from Medicaid were disenrolled not for eligibility but because of administrative errors or not filing paperwork in time.
Neither can effectively explain the sharp increase in personal consumption relative to wages.
Savings Tapped Out
The COVID-19 stimulus provided huge excess savings to the typical American household. Throughout the pandemic, savings balances ballooned to $4.5 trillion – a record high. In the aftermath, the average saving rate dropped below the pre-pandemic trend to 250bps below what was expected. Americans outside the top quintile have begun to draw down savings below what was on hand before the pandemic.
With cash savings dwindling, many are raiding their 401(k)s. Fidelity states that 12.6% of all 401(k) account holders took a hardship withdrawal or borrowed against their 401(k) thus far in 2023. Borrowing against one’s 401(k) is roughly in line with pre-pandemic trends. However, hardship withdrawals have seen a massive 480bps increase since 2018. Thus, it is not surprising that more employees are reducing their contributions. According to Morgan Stanley, 66% of employees are reducing contributions based on cost of living or recessionary concerns. This effect is most prevalent in younger consumers, with Gen Z and Millennials at 80% likely to scale back contributions, compared to Gen X at 58% or Boomers at 40%.
With No Savings, Many are Turning to Credit
With inflation increasing the cost of everyday goods, the average American has significantly increased their level of credit card debt. According to Capital One, Americans had an average of $6,000 in credit card debt at the end of 2022, a 13.2% increase since 2021. To this effect, 53% of millennials and 41% of Gen Z state that they are becoming more reliant on credit cards, with 38% of survey takers responding they are relying on credit cards to get by.
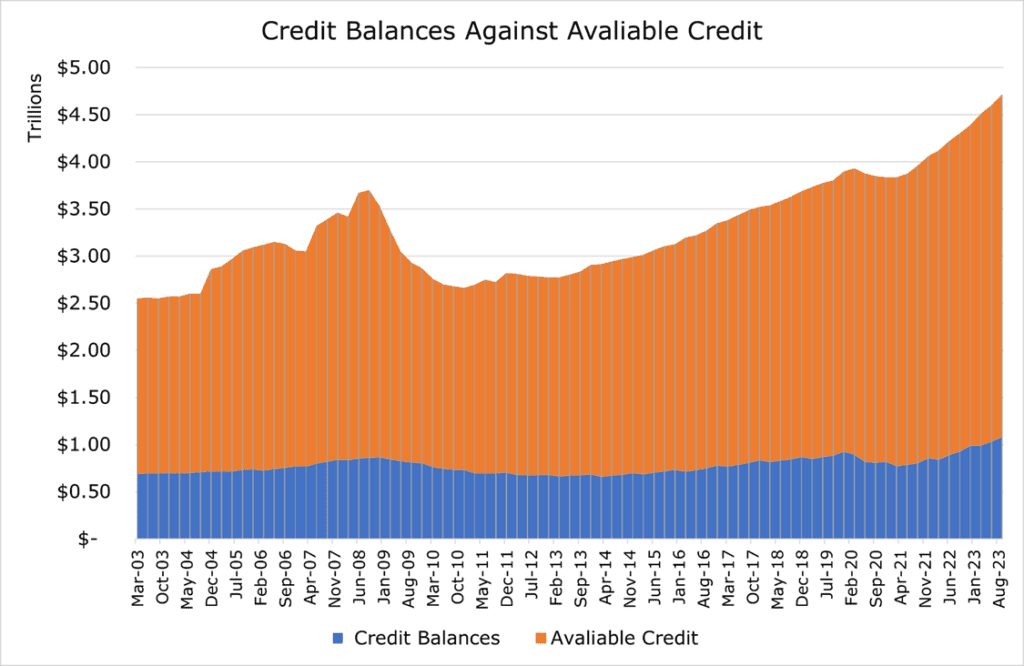
It is no wonder that for the first time since record-keeping began, more Americans (51%) now carry a balance on their cards than pay it off at the end of the month. That is a 27% increase since 2018, and that figure could increase faster, with consumer borrowing costs also being the highest they’ve ever been. While a slight jump in rates is to be expected when the Federal Funds Rate increases, this jump is out of form and likely more driven by delinquency rates and an expected slowdown in spending.
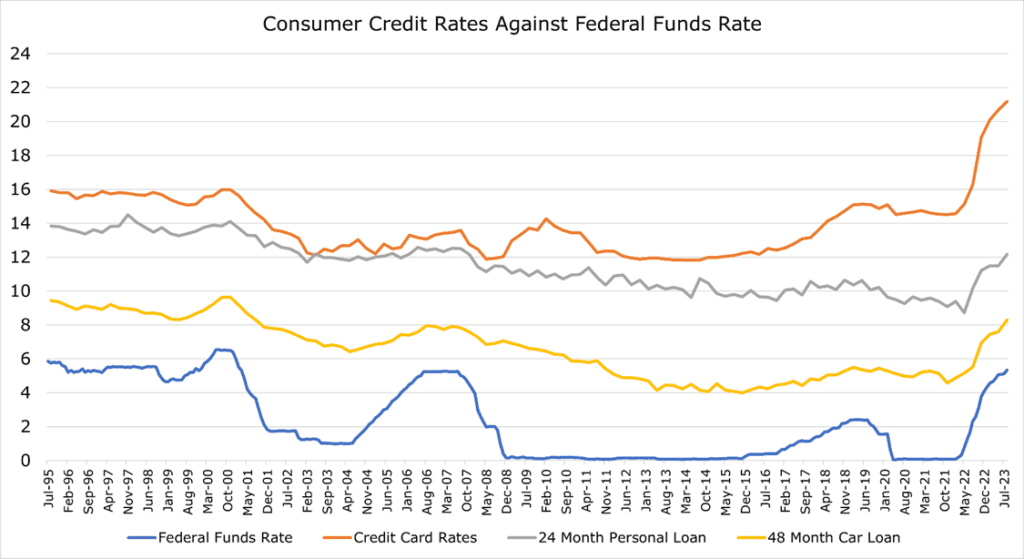
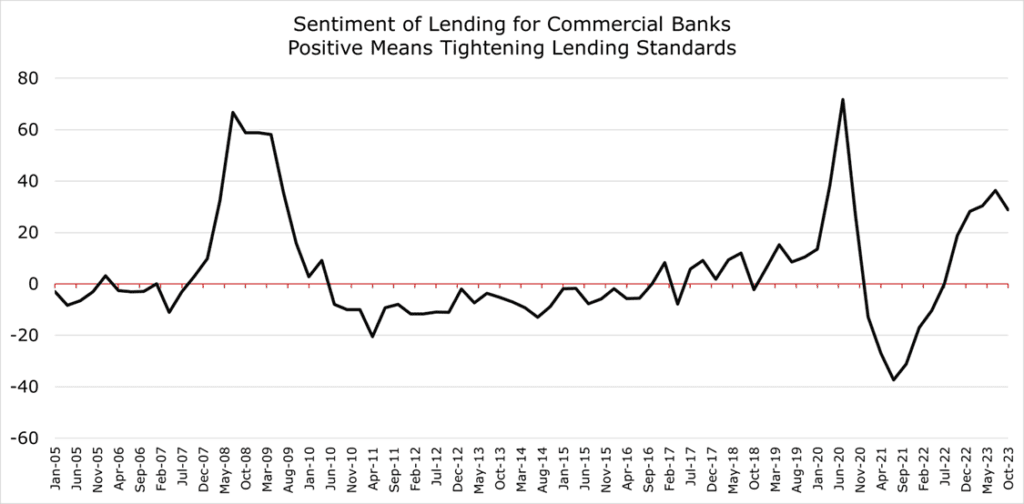
This could be the formation of a consumer-focused credit crunch, in which lenders seek better-quality clients at higher-yield credit rates. The average interest rate on credit cards is 20.72%, with other types of consumer credit rising in tandem. Banks have already begun to tighten standards for consumer lending, with 28.9% stating in October that they will be tightening standards for lending, which has been a leading indicator for recession.
The bottom 50% of Americans (under 680 credit score) have seen rejection rates rise above 50%, while rejections have remained roughly similar for the top 50% of borrowers. Despite this high rejection percentage, 50% of the under 680 group state they will apply for a new line of credit. In perspective, about 36% of all consumer purchases are on credit, with 84% of US Adults having a credit card.
Credit Delinquency is on the Rise
Delinquencies are on the rise, even above what was present pre-pandemic. The rise in delinquency was previously attributed to a “return to form,” with the pandemic seeing trillions of transfer payments to individuals, allowing them to become current on accounts. However, the September quarter release showed a sharp spike above what would be considered typical even before the pandemic, particularly among younger consumers with other forms of debt like Auto or Student loans.
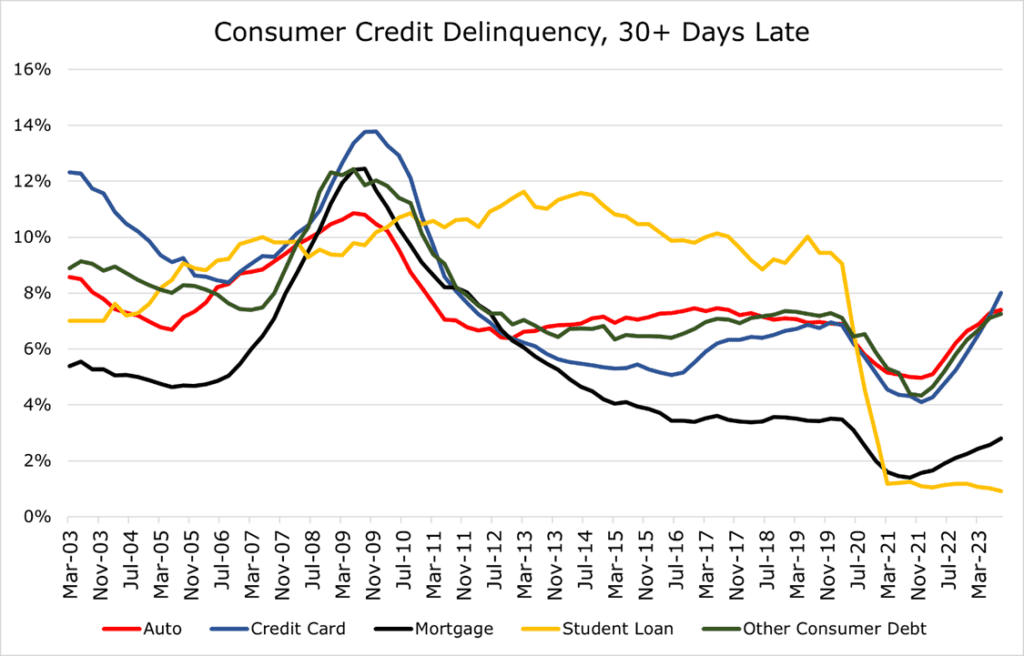
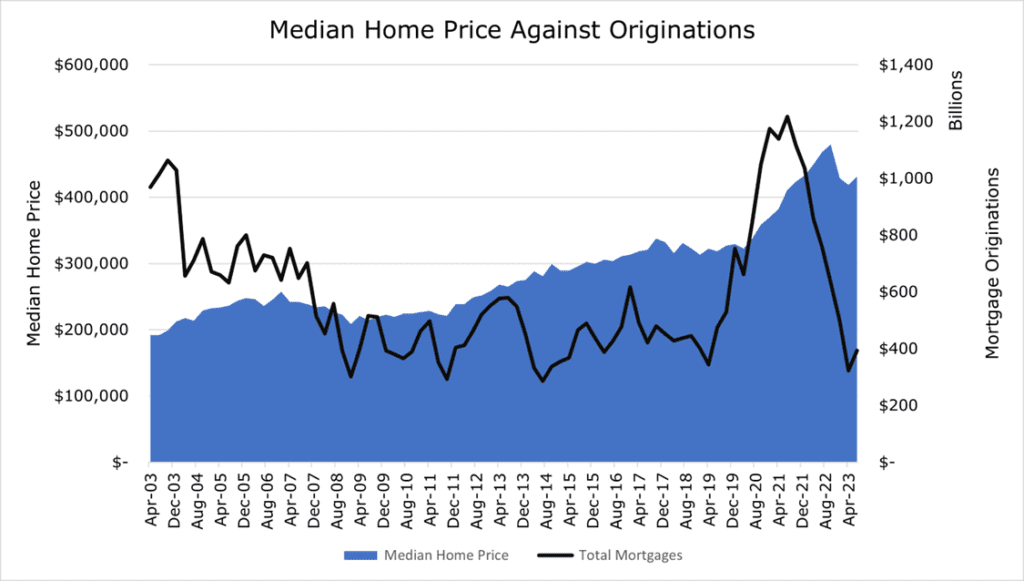
While transitions to delinquency on mortgage debt is still below pre-pandemic trends, 30-60-day mortgage delinquency is returning to line and becoming more common. During COVID-19, when interest rates were low, banks originated more than $1.2 Trillion in new mortgages, more than ever before.
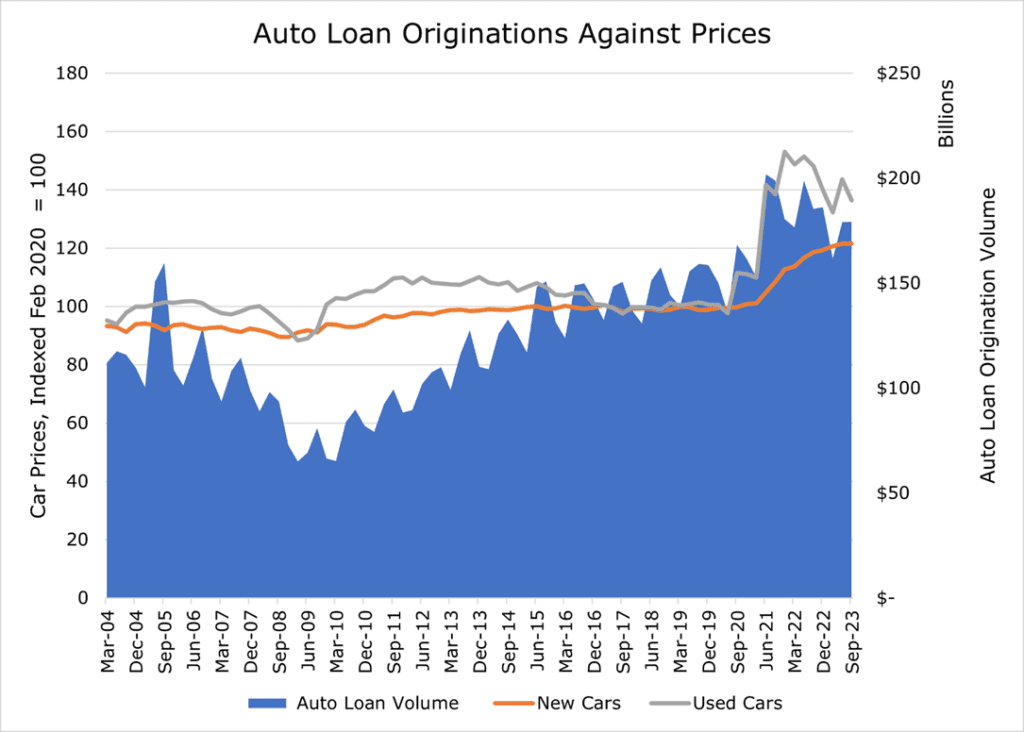
The acute shortages in semiconductors and supply-chain lag also caused car prices to balloon, forcing more consumers than ever before to get an automotive loan. Banks see these as relatively safe even for subprime buyers for the same reason they see mortgages as safe: the loan’s principal is theoretically secure in the car’s resale value. However, the car market has begun to cool down significantly leaving many underwater on their auto loans. Delinquencies on auto loans are the highest since 2008, rivaling even credit cards.
Housing Costs are Only Going Up
For the average person to be considered “cost burdened” by housing, you need to spend over 30% of your income on housing. For the first time in history, the average American renter (approximately 40% of all Americans) is now in this category.
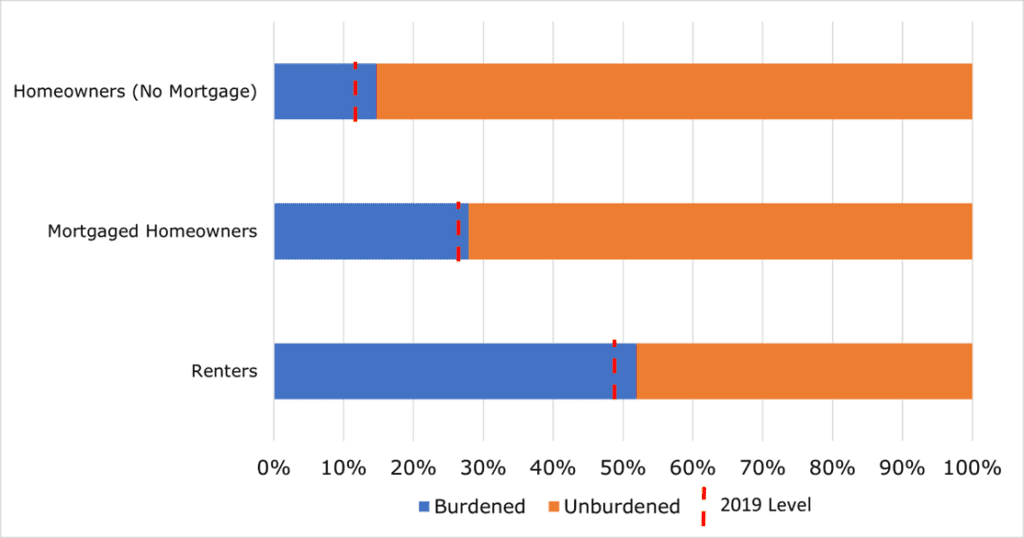
Census data shows that it is no longer the case that surging demand means more supply for housing, with new housing construction lagging significantly behind population growth. This has directly led to a massive increase in housing prices. Even those who own their home are not spared, with the ballooning price of houses contributing to a 4% year-over-year increase in property tax rates as property assessments surge with home inflation.
New mortgage originations are at historical lows, rivaling the level after the housing crash in 2008. Since the underlying value of the house can at least partially recover the loan’s principal if the consumer goes into default, banks consider them less risky. With originations drying up, this could further pressure the consumer in unsecured areas like credit cards.
Student Loan Moratorium Over
The pause in student loans for the pandemic allowed borrowers $260 billion in additional consumption throughout the pandemic. This represents somewhere between 0.1% and 0.8% of all monthly consumer spending. While this might seem small, the knock-on effects have severe consequences in other areas. Of all student loan borrowers, 85% said they would face strained finances due to the resumption of payments, with 22.6% of student loan holders stating they would miss a payment on some form of credit due to the resumption.
While student loans affect a small portion (13%) of the population that skews young, this debt represents 9% of all consumer debt outstanding at $1.6 trillion, second only to mortgages. This could compound the higher banks lending standards for new credit, as student loans were already considered risky, with close to 10% delinquency pre-pause. Delinquency rates could skyrocket to all-time highs as the combined pressures on consumers’ finances mount.
Competitive Comparisons
In conclusion, the current economic environment is challenging for retail sector and consumer discretionary investments. Despite a resilient labor market, long-term inflation has seriously strained consumers. The dependence on high-interest debt and dwindling savings have been key factors in propping up consumer spending. It is possible that part of the reason for sustained inflation could be consumers continuing to spend beyond their means. This sustained demand, especially when supply is still constrained, can lead to price increases contributing to inflation. Adding to this, the sharp and sudden unexpected increase in the price of goods can lead to a wage-price spiral, where demands for increased wages fuel more consumption, driving prices up further.
We believe caution is the best action in the retail sector as broader conditions have deteriorated. Consumers will likely become more cautious of their spending, and gains in the retail sector will erode as consumption moves back in line with the pre-pandemic trend.