Economic and Market Review
September 30, 2024
| Equity Indices | YTD Return |
| Dow Jones | 11.46% |
| S&P500 | 19.92% |
| NASDAQ | 20.58% |
| MSCI – Europe | 12.96% |
| MSCI–Emerging | 9.55% |
| Bonds (Yield) | |
| 2yr Treasury | 3.58% |
| 10yr Treasury | 3.71% |
| 10yr Municipal | 2.61% |
| U.S. Corporate | 4.72% |
| Commodities | |
| Gold | $2,668.36/oz |
| Silver | $31.53/oz |
| Crude Oil (WTI) | $71.77/bbl |
| Natural Gas | $2.92/MMBtu |
| Currencies | |
| USD/CAD | $0.74 |
| USD/GBP | $1.32 |
| USD/JPY | ¥144.49 |
| USD/EUR | $1.10 |
Overview
The Fed cut rates by 50bps. The market rallied on the news but flattened out as the month progressed, with the S&P ending the month up 2.8%. However, the last time the Fed cut rates by 50bps with markets at all time highs was in October 2007 – what followed in 2008 came to be known as the ‘great recession’.
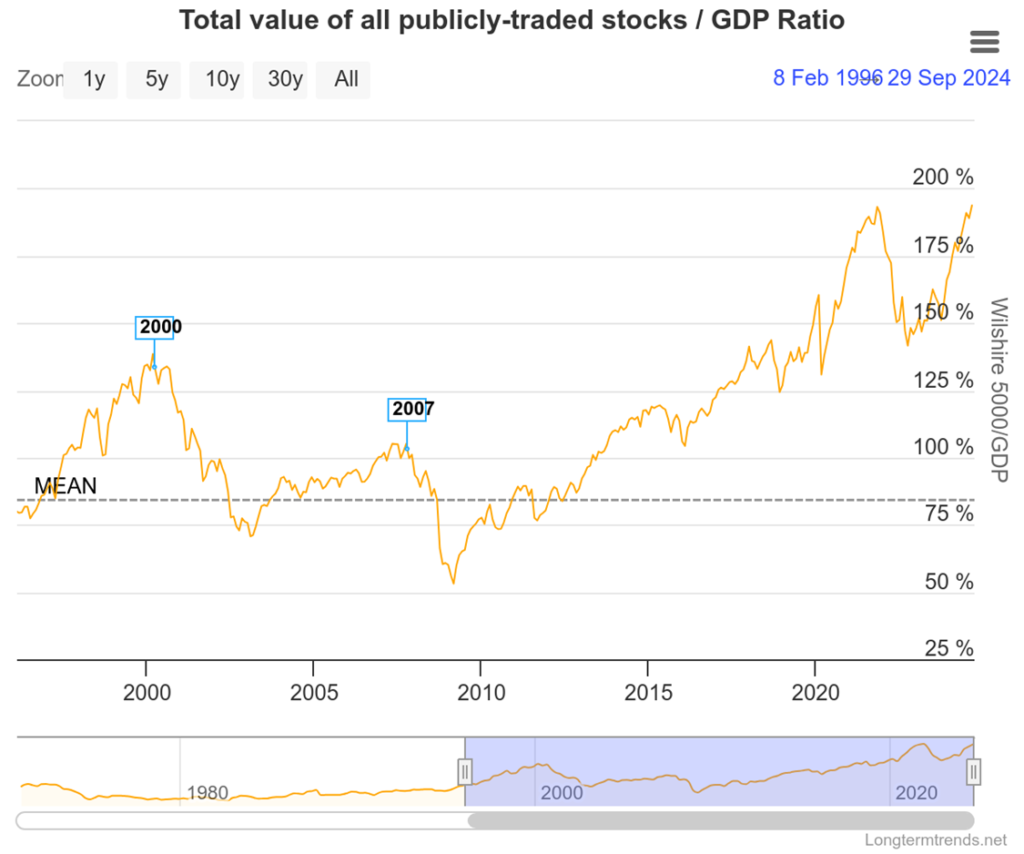
As a refences, at the time Debt to GDP was only 64%, deficit was $163 billion, and market cap to GDP was 105%. As of now, debt to GDP is 122%, the deficit is $1.9 trillion, and market cap to GDP is the highest ever recorded at 193%.
Most economists had priced in only 25bps, indicating that the Fed may be over-correcting. However, economists do remain split. According to the WEF, around half of economists feel that the economy will remain at its current level going into 2025, with 37% projecting a downturn.
Gold continues to lead commodities, increasing 5.53% over the month. Silver saw a stronger rally at 9.5%. While still slumping far below its typical levels, oil saw a small boost toward the end of the month with increased tensions between Israel and Iran sparking fears of a widening of the conflict.
Developing nations welcome rate decreases, with more than 50 developing nations spending approximately 10% of their revenues on debt servicing costs. The US may soon join the club, with the CBO projecting the US breaking $1 trillion in interest payments per year starting in 2025.
China Tries Everything and the Kitchen Sink
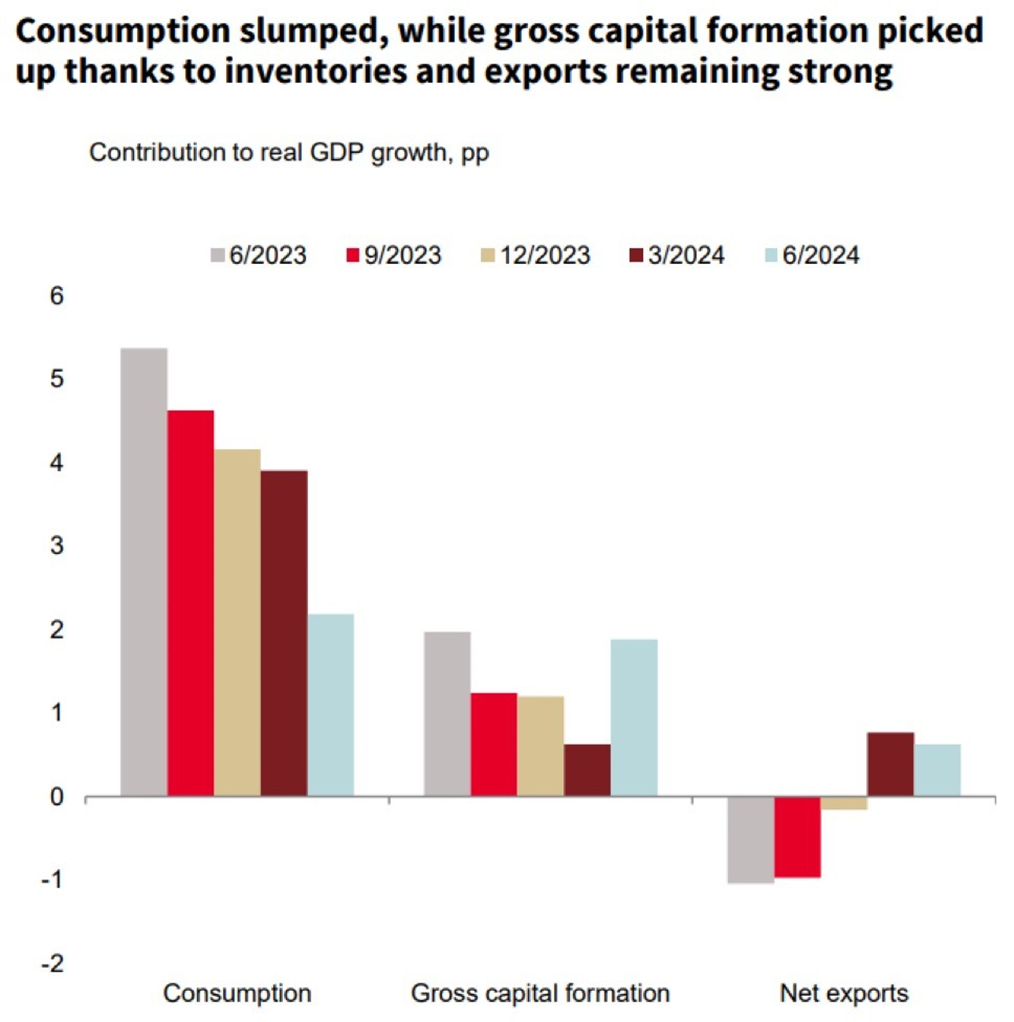
While net exports have remained strong — helped by weak imports tied to lower consumption — other economic indicators for China are bleak.
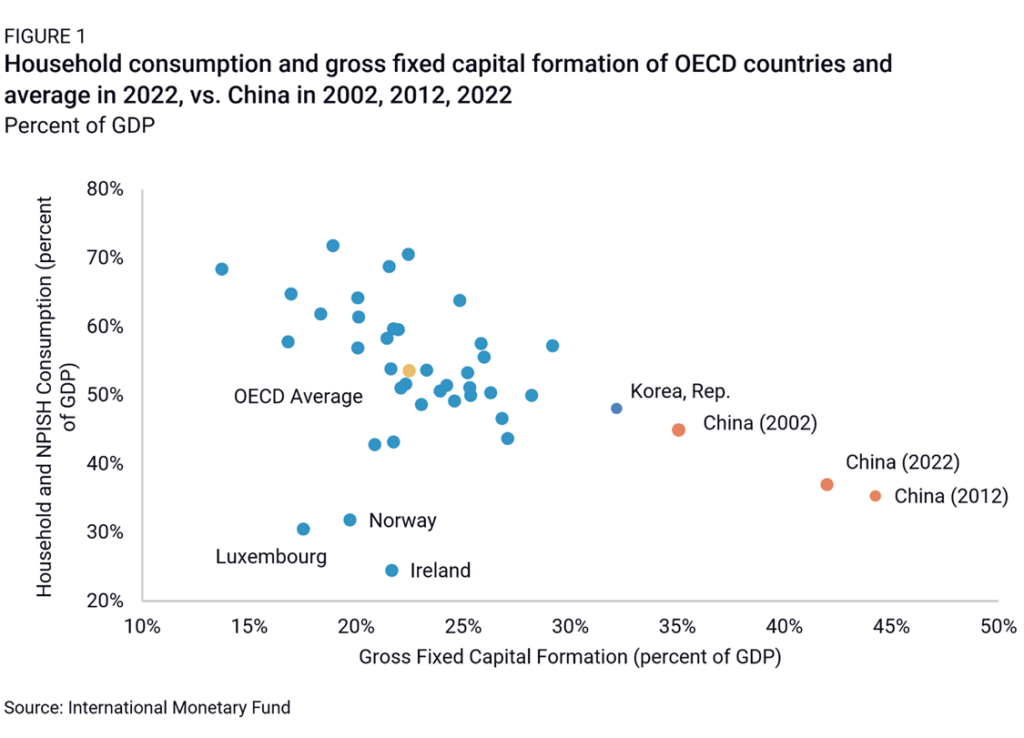
China’s longstanding inability to shift away from reliance on fixed asset investment and exports persists. As a percentage of GDP, household consumption has remained a small component of total GDP, averaging around 40% compared to the OECD average of 60%.
On the consumer side the most useful indicator is the consumer confidence index provided by the Chinese Bureau of Statistics, which has shown a substantial lack of recovery in propensity to consume since 2022.
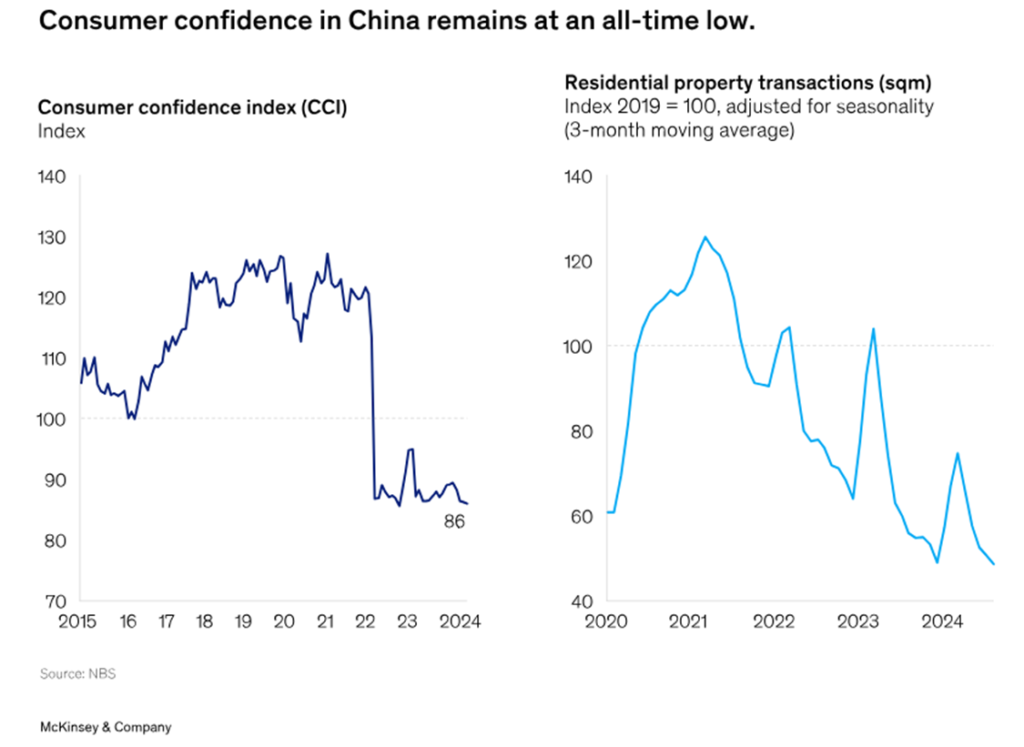
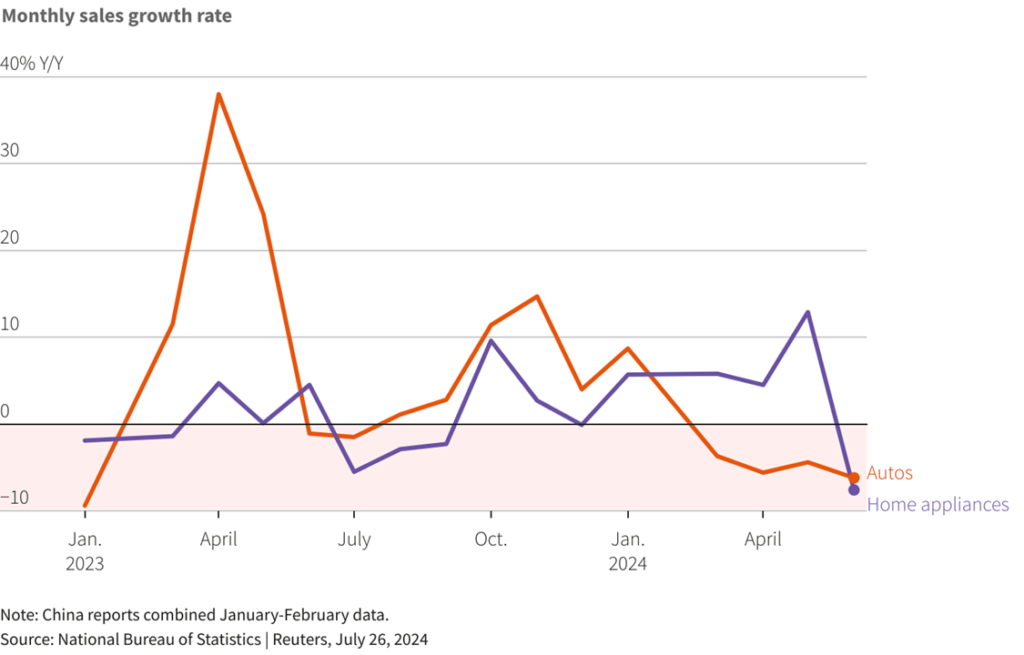
Prices across the Chinese economy are collapsing with a dramatic increase in inventories across all sectors. Sales data of consumer durable goods has also indicated a sharp decline in consumer sentiment in China. The effect is especially seen in real estate, where a crisis earlier in the year destroyed domestic appetite for new sales.
The total sum is a heavily deflationary environment for the RMB for the last 5 quarters (also known as the Chinese Yuan). Deflation has suppressed already weak consumer sentiment and credit conditions causing real GDP to further move down towards 4%. For Chinese policy makers and global markets who are used to China regularly outputting a real GDP between 5-15%, this figure is worrying.
The PBOC (People’s Bank of China, the Fed of China), announced an aggressive stimulus package, designed to inject liquidity into the system and boost real GDP to 5% by the end of 2024.
| Policy | Intended Effect |
| 1st Round $142 Billion Special Issuance | Provide $114 in allowance to households with 2 or more children (around 10% of average monthly income for families). Increase subsidy for replacement of household durables. |
| 2nd Round $142 Billion Special Issuance | Refinancing for local municipalities |
| Reserve Requirement Cut by 50bps to 6.6% | Lower borrowing costs for consumers, increase bank lending. Increase liquidity by ~$140 billion |
| Reverse Repo Cut by 20bps to 1.5% | Further increase liquidity in the banking system, lower borrowing costs across all levels |
| 100% Insurance for municipalities buying unsold homes (up from 60%) | Reduce housing inventory |
| (October) Cut minimum downpayment from 25% to 15% | Reduce housing inventory |
| (October) Mortgage rate cut of 50bps to an average of 6.9% | Reduce housing inventory |
| (Unconfirmed) Scrap limits on property ownership in hard-hit localities | Further reduce housing inventory by increasing property ownership among consumers |
| (Later in the year) Further Reserve cut by 25-50bps to ~6-6.25% | A further $140 billion in liquidity to the banking system |
The main goal of all of this is to make credit as cheap as possible to push the demand side away from saving to spending.
While the effects will take time to fully impact, Chinese brokerage demand could offer a leading indicator. Just one week ago, Chinese retail investment demand was near all-time lows, but now brokerages across China are staying open over the weekend and long past market hours to keep up with account demand.
Valuations Explode with Rate Cut
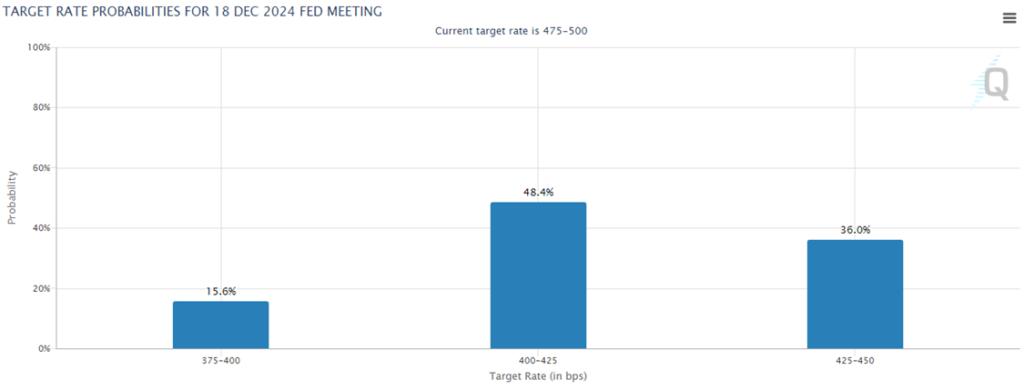
With the Fed’s 50bps cut, with an estimated 50-100bps more on the way by the end of the year, markets have continued their climb.
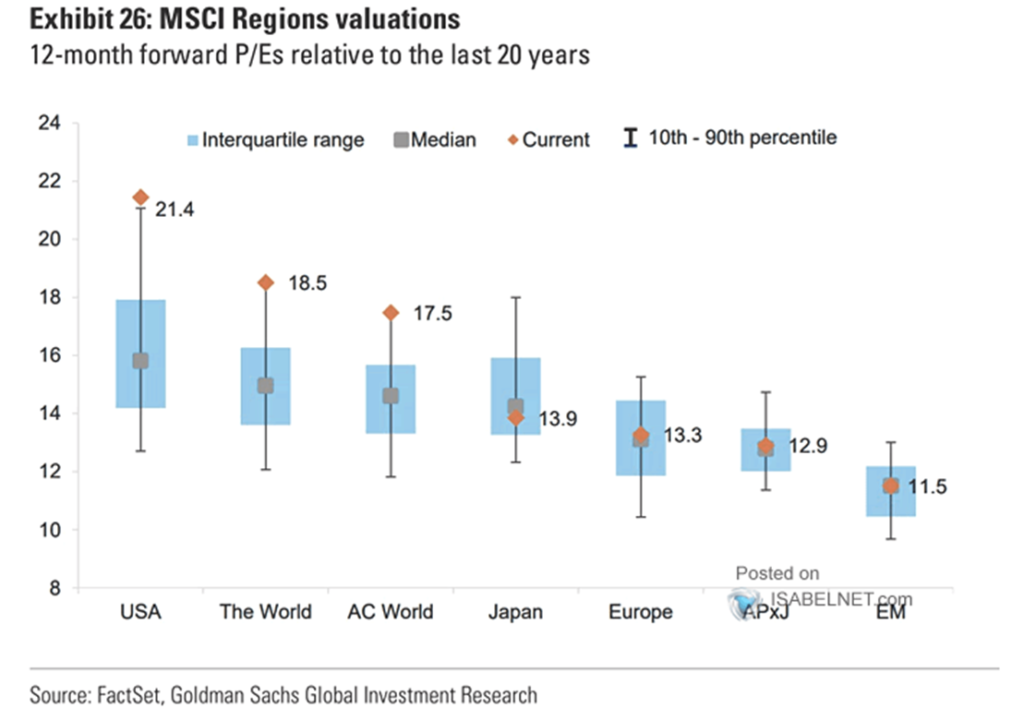
Globally, US markets lead forward valuations, far above their average premium. Outside of the US, valuations are either at their long-term median, or slightly below in the case of Japan.
US Market capitalization (as measured by the Wilshire 5000) to GDP has reached a record high, of 193%. The dotcom bubble burst at 138%, with the long-term mean since 1970 being 80%.
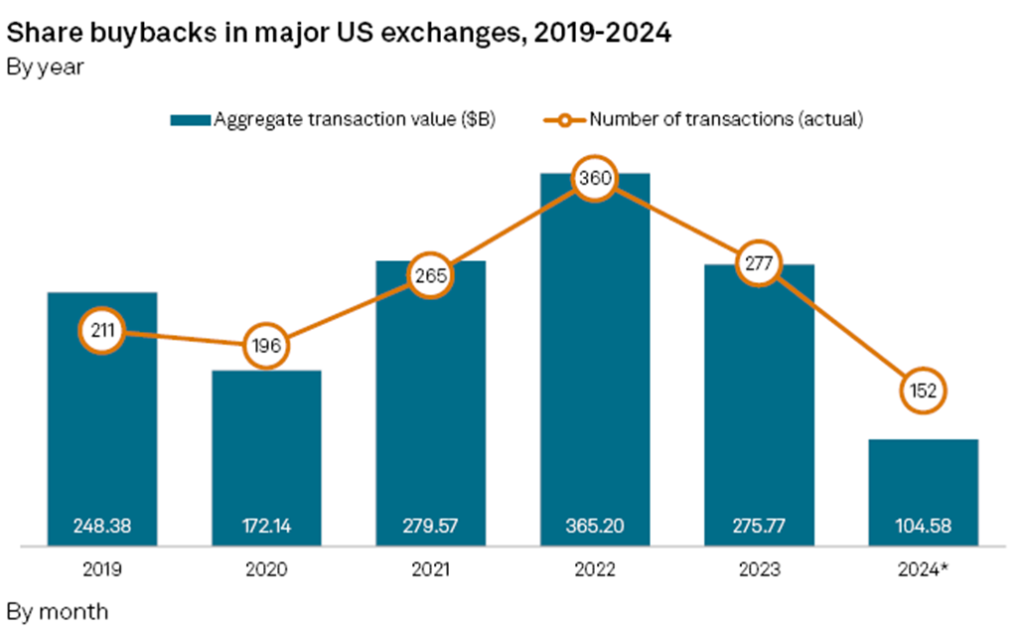
In the US share buybacks are their lowest level since the peak of the pandemic in 2020. This could indicate that firms are waiting for valuations to get cheaper before engaging in buybacks. Equally, according to Harvard Business Review, it could be that companies are preparing for a recession and choosing to warehouse cash rather than spend excess on repurchasing overvalued shares.
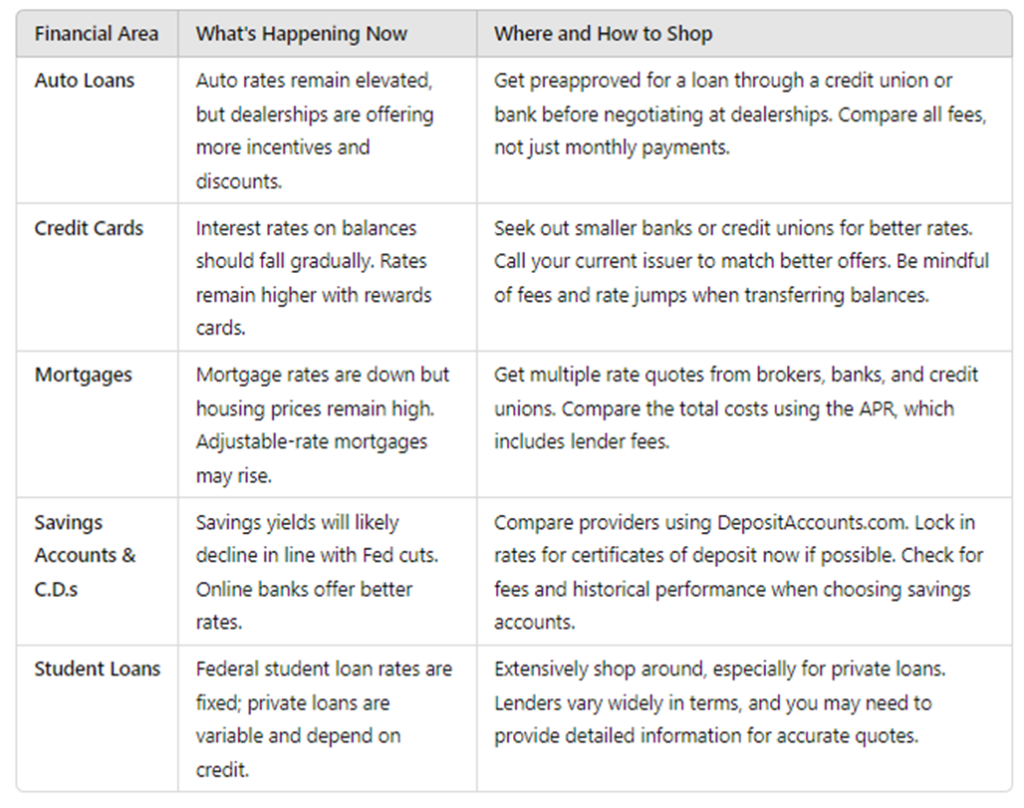
What Do Rate Cuts Mean for The Consumer?
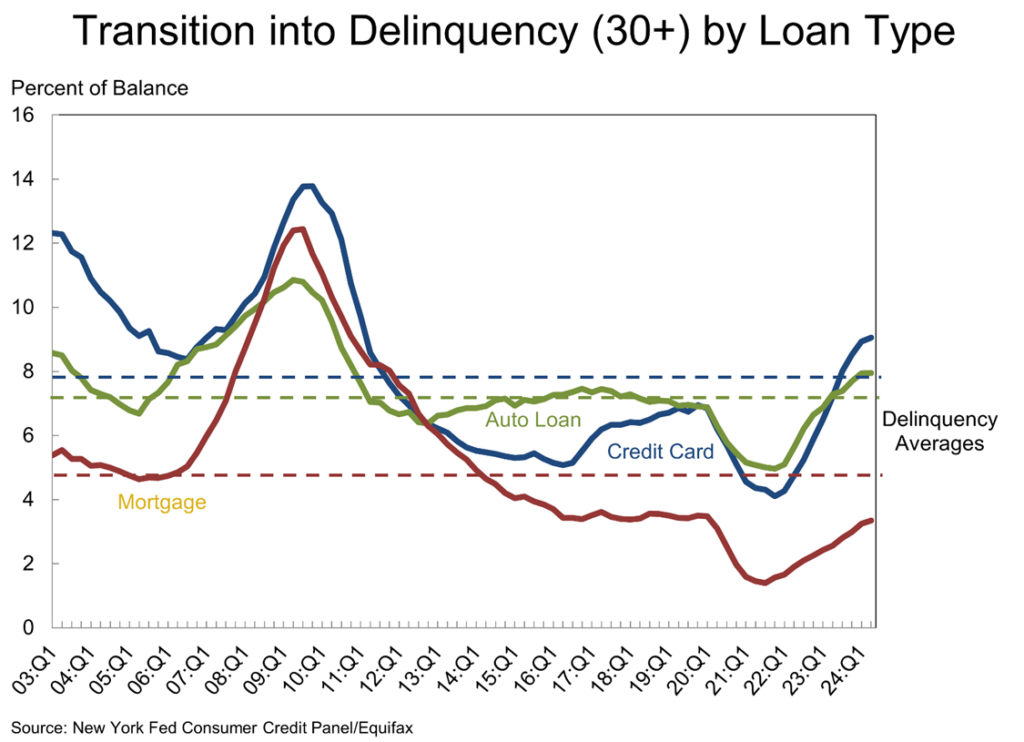
When the Fed cuts rates, borrowing becomes cheaper. This can have substantial trickle-down effects for the entire economy. Currently delinquencies are on the rise across all types of credit, with auto loans and credit cards above long-term averages.
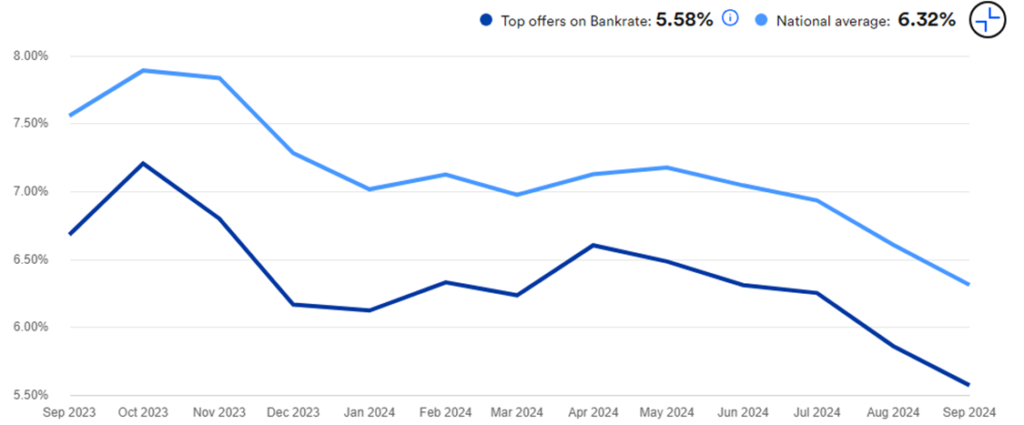
Mortgages are typically the first to feel the effects of rate cuts, with some relief already seen. The national average for a 30-year fixed mortgage has declined by 124bps since September 2023, with refinancing terms falling by 142bps.
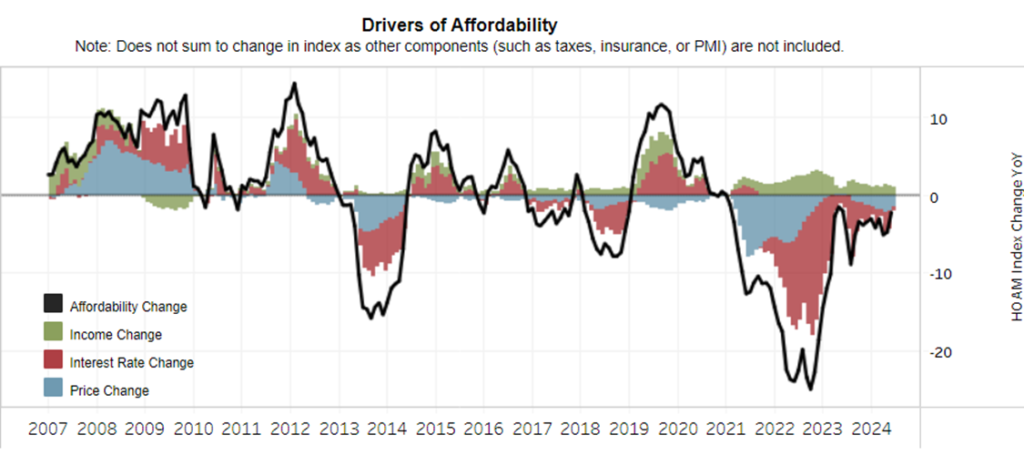
However, headwinds still remain on affordability. The Atlanta Fed tracks an index of housing affordability, constructed so that any level below 0 indicates a low level of affordability for housing. Despite a significant reduction in interest rates and increases in income, prices are still through the roof, fully offsetting rate cuts and salary increases.
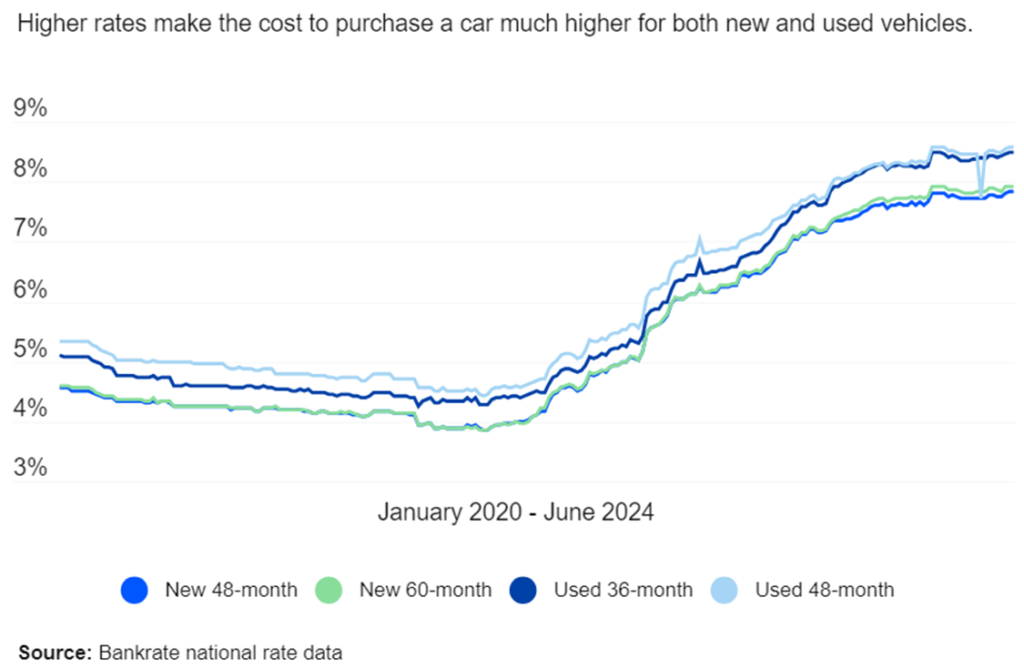
With used and new car prices still more than 10% higher than their pre-pandemic counterparts, more people are still turning to auto-loans to afford even a used vehicle. Auto loan originations hit all time highs during the pandemic and continues to be at elevated levels.
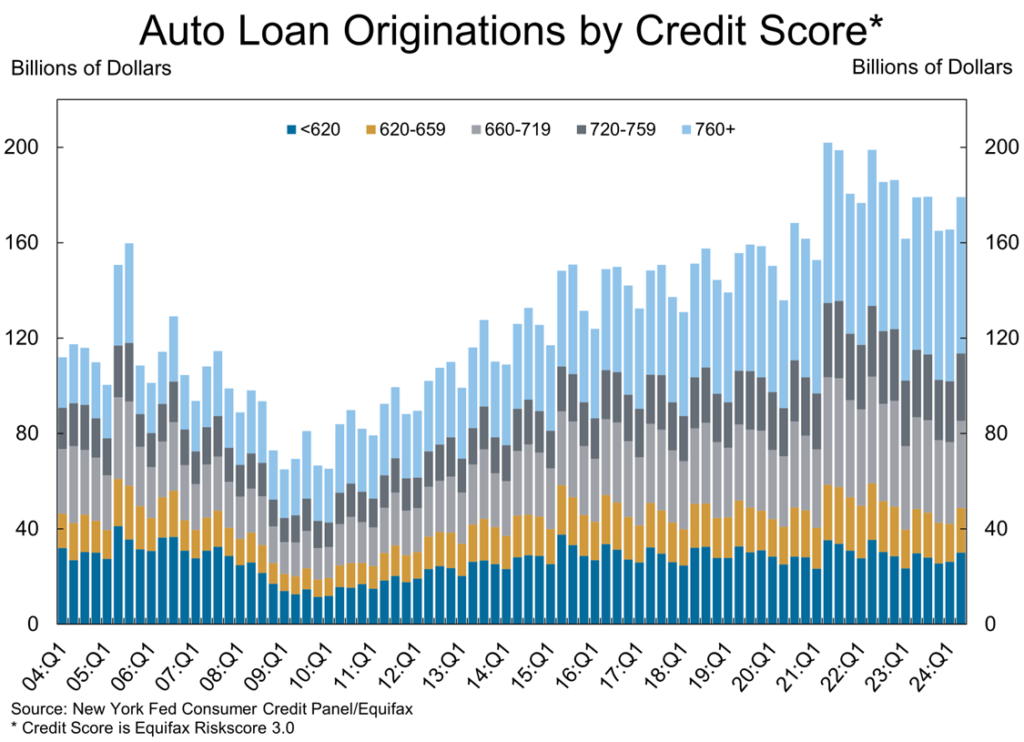
Though according to Kelly Blue Book, there is increasing pressure on dealers to lower prices with an ongoing sales-slump independent of financing terms. There likely won’t be a budge in financing terms in 2024, but depending on the pace of rate cuts and consumer demand, rates and auto prices could both begin to come down going into 2025.
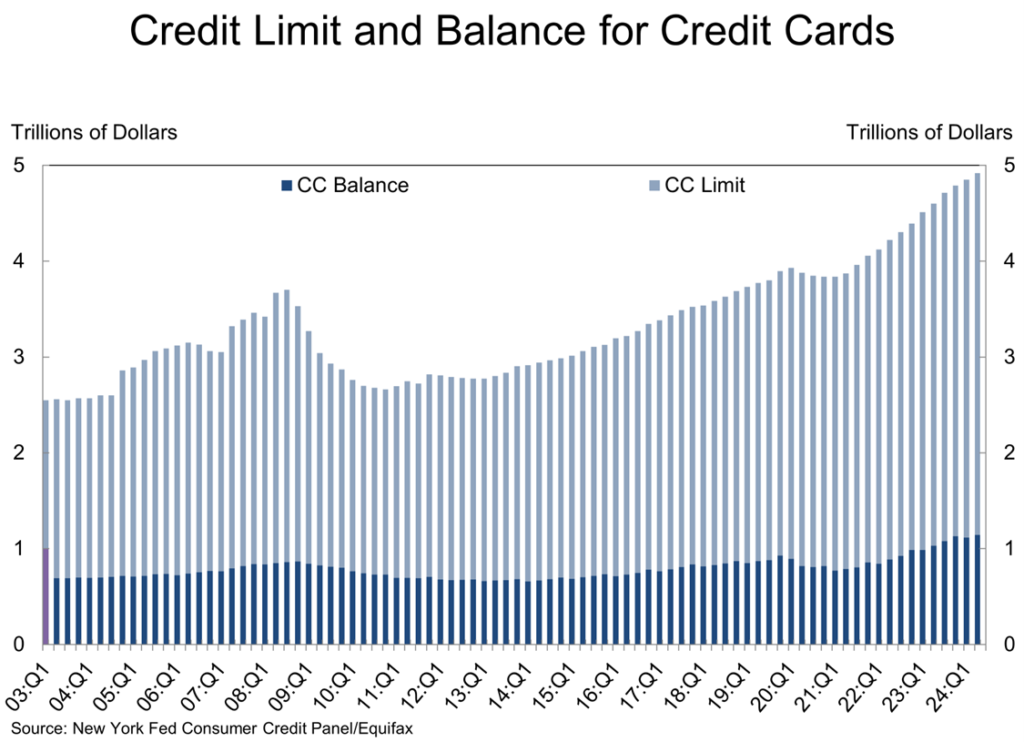
Credit Card delinquencies are at the highest level since 2008. Almost certainly due to credit card interest rates hitting levels never seen, with an average of 24.92% across all cards.
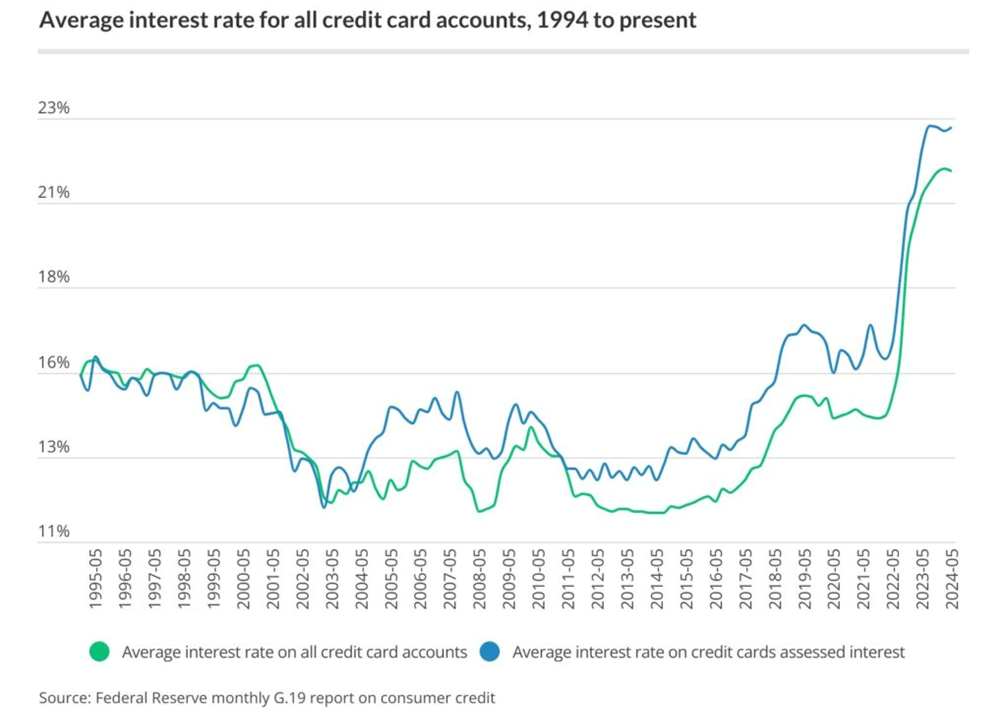
Credit card rates will take longer to come down, with credit card balances and utilization still elevated despite high rates. Utilization is currently at an estimated 23.2%, compared to 2009’s peak of 27.9%, and the typical average of 20%.
Interest on Debt Will Top $1 Trillion for First Time
The U.S. budget deficit is now $1.9 trillion, up 24% since last year. Even with tax receipts up 11%, outlays have grown quickly at 14%, with the interest cost increasing 30% year over year. For 2025, the CBO projects that net interest payments will breach $1 trillion.
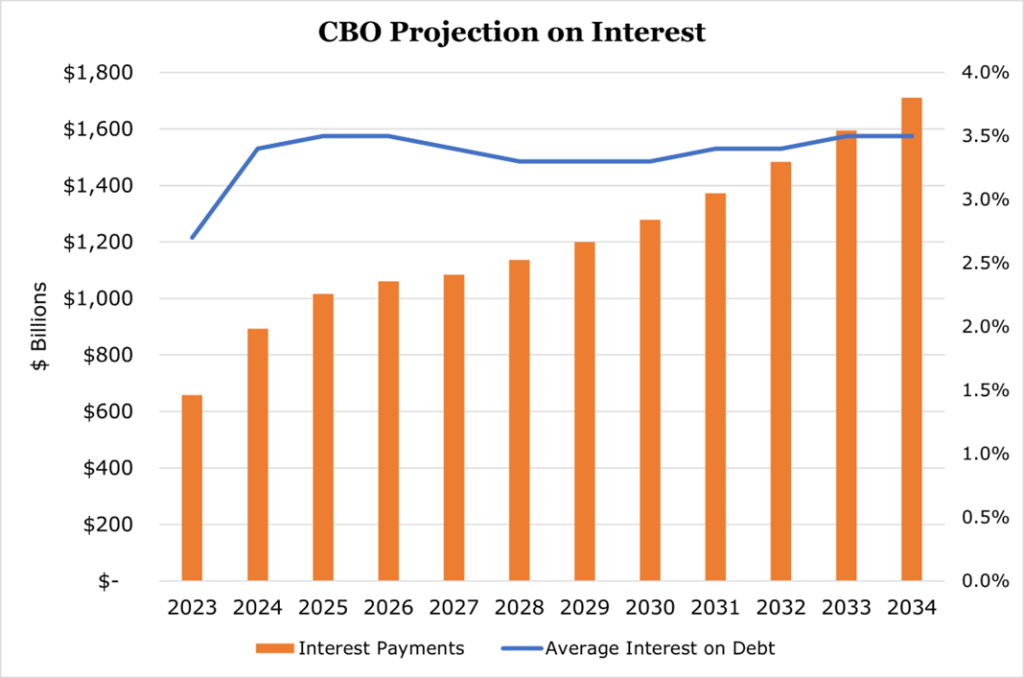
This could mark the beginning of the snowballing effect warned by the CBO. As the government borrows to pay for greater cost of interest, the future interest payments go up.
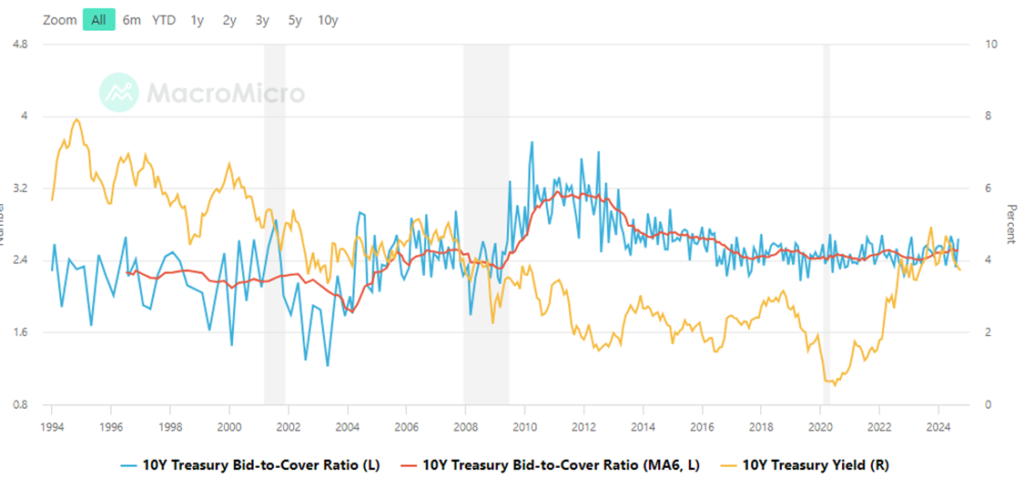
The metric to watch for if the Treasury is issuing debt at a rate faster than the market can bear is the bid to cover. Any ratio over 1.0 indicates that there are more buyers than sellers in the market. However, as primary Treasury dealers (like investment banks) are obligated to buy whatever the Treasury is selling, any ratio approaching 1.0 would be detrimental to the financial system.
The Fed could have a part to play for the debt level, with the CBO estimating that 2/3 of the future interest cost to 2034 will come from interest rates being higher for longer. If the Fed continues to aggressively cut, it could signal the beginning of monetization.
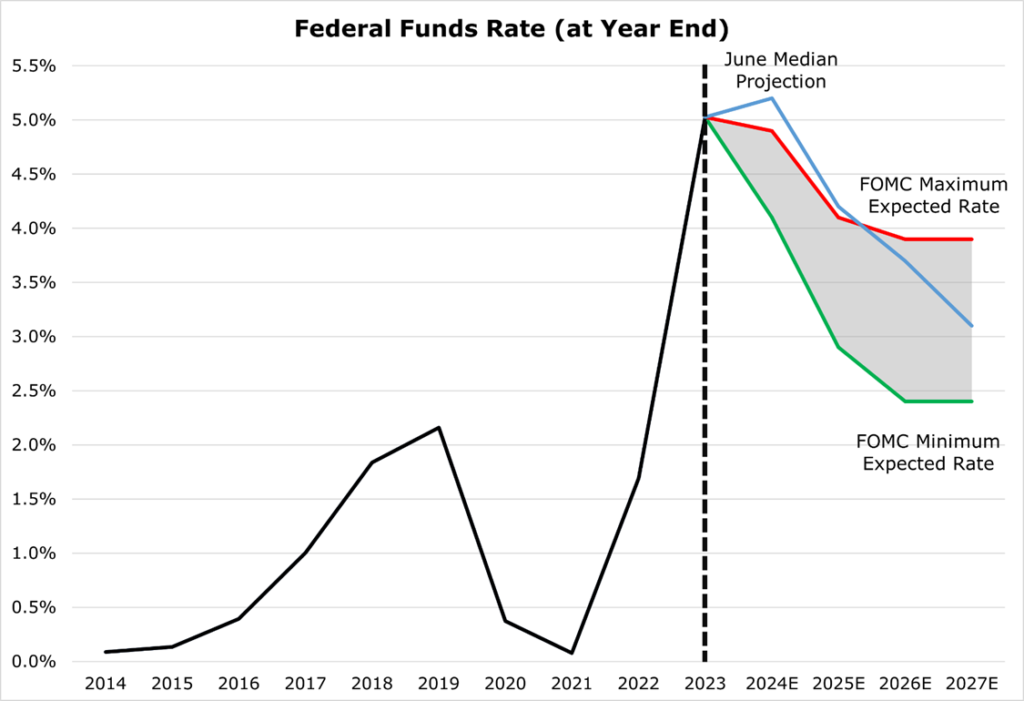
ompared to the June projection, rate expectations have cratered among the FOMC over the short term. While this could indicate inflation moderating more rapidly soon, it could also indicate that the FOMC is trying to get ahead of a recession.
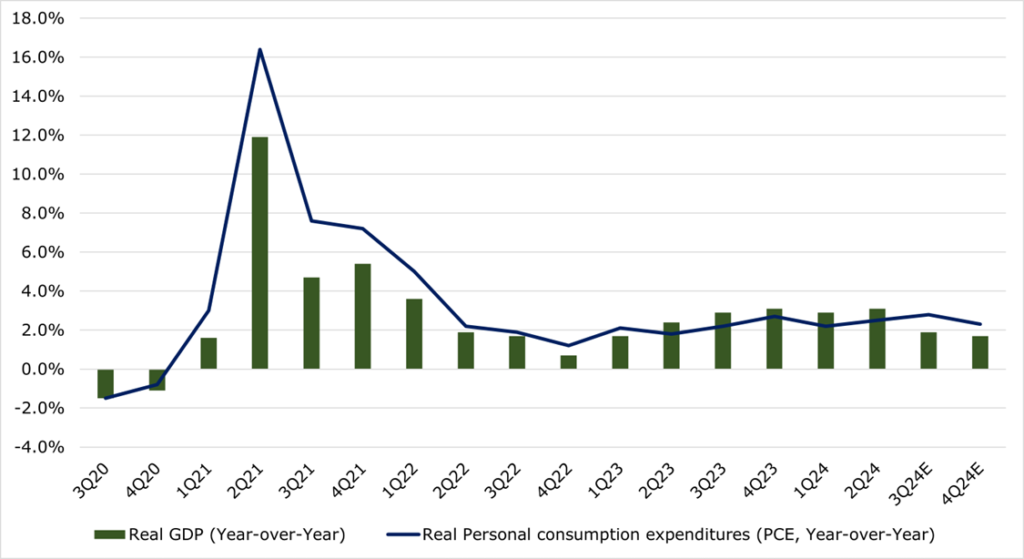
Real GDP growth is expected to moderate for the last two quarters of the year while real PCE is expected to stay at an above-target level.
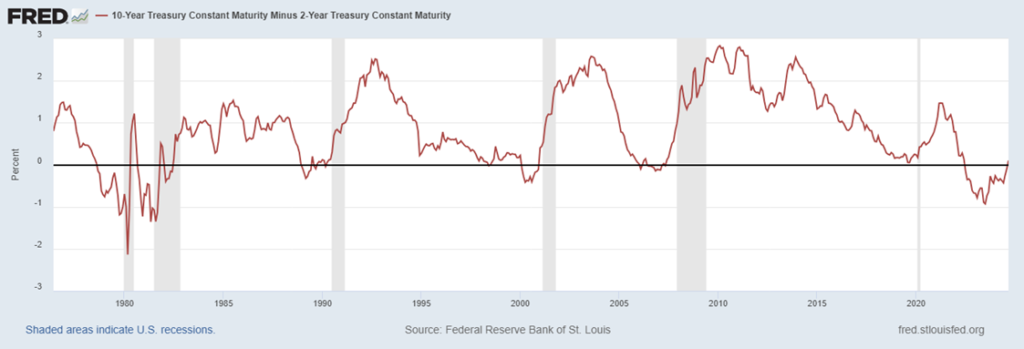
Finally, the 10-2-year yield curve has finally entered positive territory, and has uninverted after the longest stretch of inversion in history. Typically, it is not the inversion of the curve that is an indicator of recession but rather when it returns to normal.
US East and Gulf Coast Dockworkers Strike
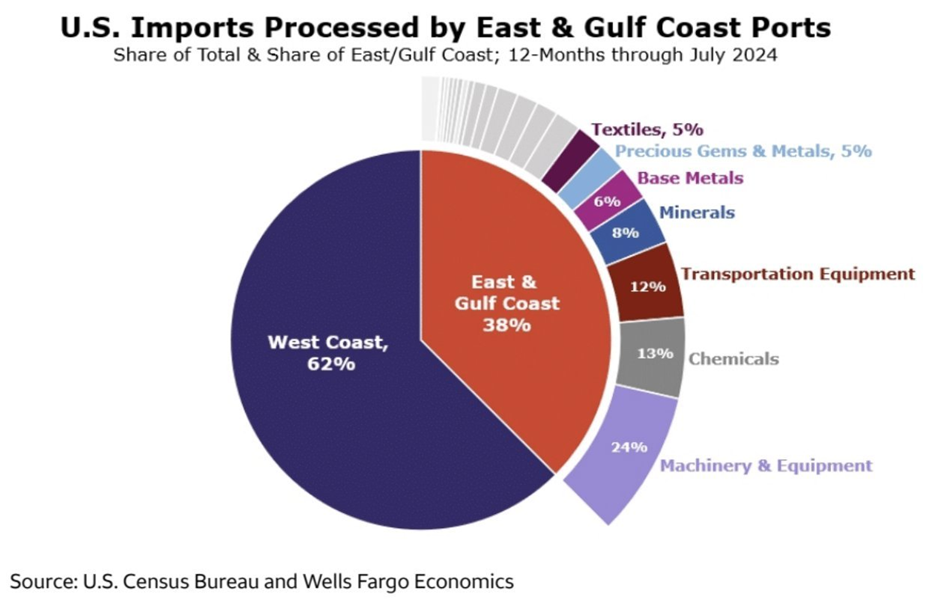
For the first time since 1977 more than 50,000 dock workers across the East and Gulf Coast are on strike to protest automation, among issues of pay and benefits. These ports cover 38% of all U.S. imports, valued at an estimated $5 billion per day. The economy is already teetering, and a strike lasting longer than a few weeks would send the economy over the edge into a recession.
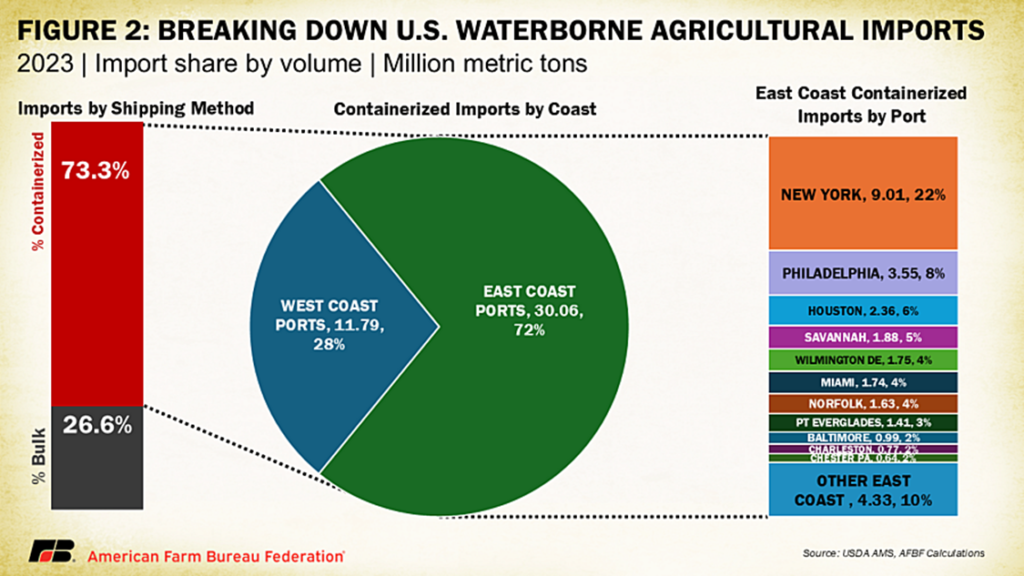
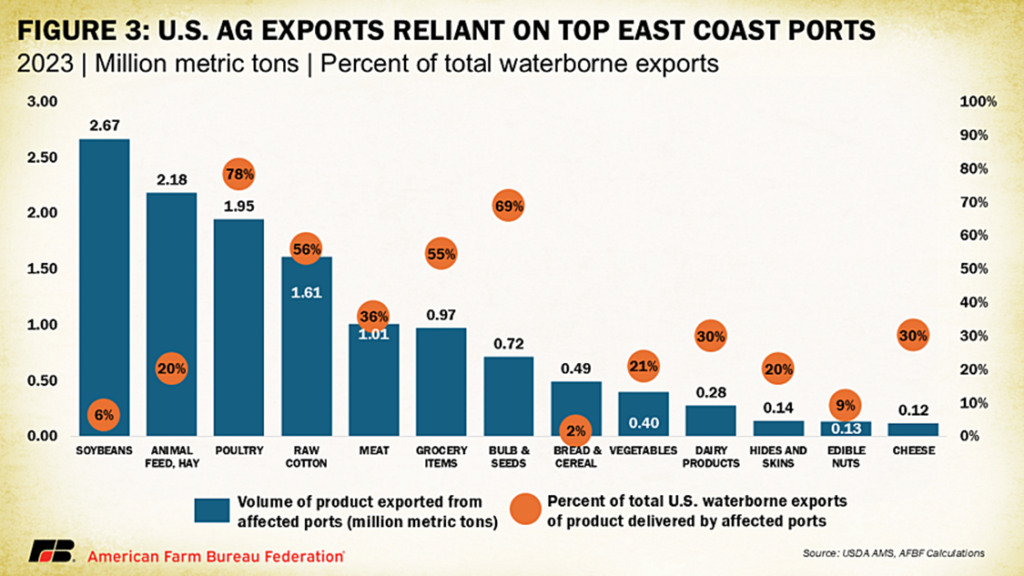
On a more granular level, the agricultural export industry is incredibly dependent on the ports, with products like poultry seeing 78% of exports exit the US on an east coast port.
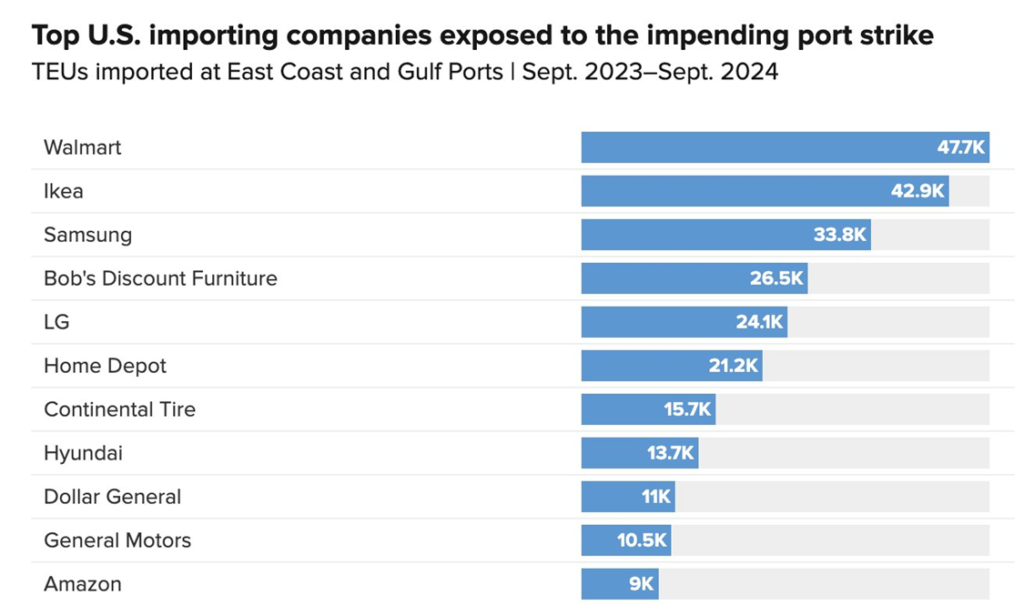
According to NBC, Walmart and Ikea are the most exposed companies, with nearly 50,000 TEUs (Twenty-foot Equivalent Unit) imported on east coast and gulf coast ports for the trailing twelve months. Finished goods at specific risk are European toy or alcohol imports which exclusively utilize east coast ports, and components for automobiles to be manufactured in the US.
It is not just finished goods and exports that are at risk. 72% of containerized agricultural imports originate from east coast ports, with the Farm Bureau federation estimating 53% of agricultural imports are at risk. For consumers, this could mean revamped grocery inflation as stores see lack of inventory for tropical fruits, some vegetables, and fruit juice. Commodities that could also see squeezes are salt, cotton, and wood which are almost exclusively imported on the east and gulf coast.
Gasoline prices are unlikely to be effected, as oil prices continue to be low, and most imports of oil are done through non-union ports.