Economic and Market Review
June 1, 2025
| Equity Indices | YTD Return |
| Dow Jones | -0.20% |
| S&P500 | -1.15% |
| NASDAQ | -0.20% |
| SPDR Developed World Ex-US | 14.42 |
| MSCI–Emerging | 8.41% |
| Bonds (Yield) | |
| 2yr Treasury | 3.93% |
| 10yr Treasury | 4.42% |
| 10yr Municipal | 3.32% |
| U.S. Prime Rate | 7.50% |
| Commodities | |
| Gold | $3,358.64/oz |
| Silver | $34.20/oz |
| Crude Oil (WTI) | $62.84/bbl |
| Natural Gas | $3.52/MMBtu |
| Currencies | |
| CAD/USD | $0.73 |
| GBP/USD | $1.35 |
| USD/JPY | ¥142.96 |
| EUR/USD | $1.14 |
Overview
The Treasury has stated it is ‘close’ to a ‘a couple’ of deals, with the US pushing for ‘final offers’ by June 5th to be considered before the deadline of July 9th.
On April 9th Trump paused tariffs for 90 days, until July 9th, and had stated it was hoping to reach 90 trade deals in that time. Since then, only the United Kingdom making up 2.3% of US imports has agreed to a deal with the US in early May. However, the deal itself is more political theatre than a major deal, dropping tariffs on cars from the UK to 10% and implementing a quota system for British steel and aluminum. In a major win for airlines, aircraft engines and components serviced by Rolls-Royce will be tariff free. However, the issues of food standard homogenization, pharmaceutical pricing, and digital services taxation remained unaddressed.
Inflation expectations have diverged between the US and Europe in a rare movement. The consensus forecast now expects US inflation to rise to the 3.5% neighborhood by December 2026, while European inflation will cool down to the 2.0% neighborhood. According to Apollo, the aggregate effect will likely be the continued upward pressure on rates across the yield curve, while driving down pressure on rates in Europe.
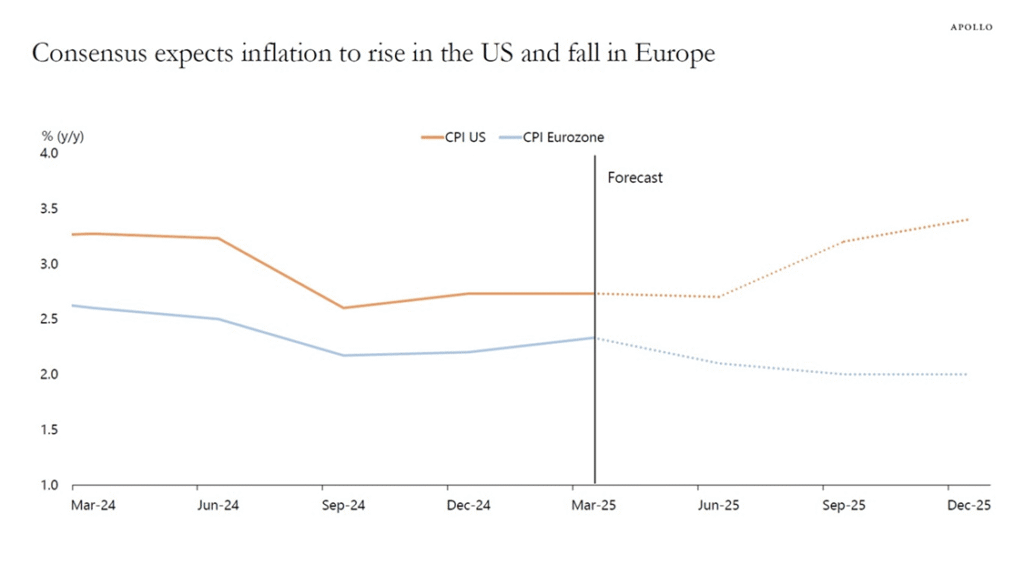
Inflation expectations have diverged between the US and Europe in a rare movement. The consensus forecast now expects US inflation to rise to the 3.5% neighborhood by December 2026, while European inflation will cool down to the 2.0% neighborhood. According to Apollo, the aggregate effect will likely be the continued upward pressure on rates across the yield curve, while driving down pressure on rates in Europe.
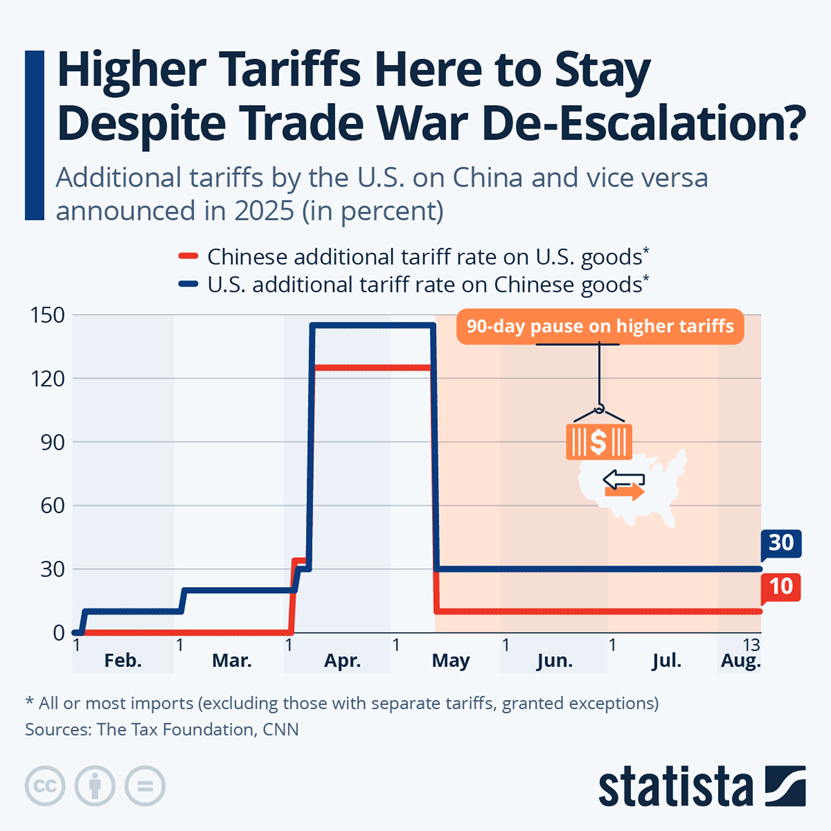
Wall Street reacted with glee to the further pauses on tariffs of certain Chinese goods to August 31st.
Separately, on May 13th it was announced that there will be a 90 day tariff reduction agreement to lower tariffs on Chinese goods to 30% from 145%, and China will lower tariffs on US goods to 10% from 125%. The S&P 500 saw its best May since 1990 and best month since November 2023 rising 6.3%. Further tariff pauses and 77% of companies reporting positive earnings surprises led to a recovery in the US equity market. However, the US Still trails globally on a YTD basis compared to the EU.
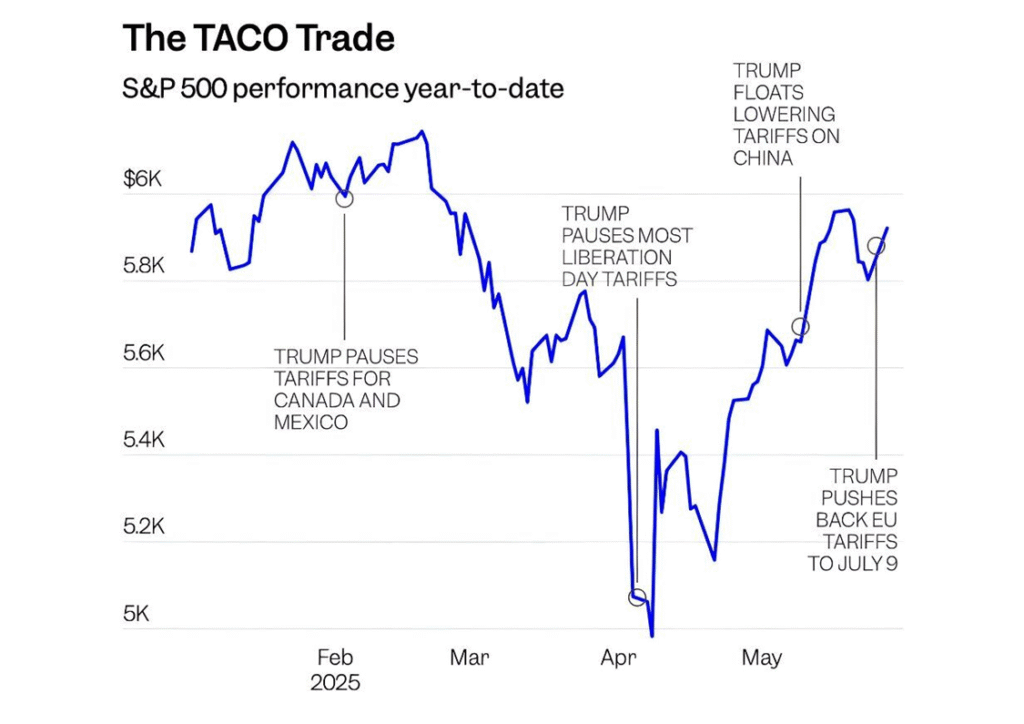
The back and forth on trade has spawned a new moniker for short-term trading on these sporadic announcements, the TACO trade. Short for “Trump Always Chickens out”, the TACO trade has investors trying to time the on-again off-again nature of tariff policy. We may see more solid policy shaking out in the first week of June, with CBNC reporting Trump and Xi are scheduled to talk sometime this week which Treasury Secretary Bessent said was ‘needed’ to un-stall talks.
Bond Market Turmoil
While the bond market turmoil may seem like a temporary tantrum, the collection of factors paint a more worrying story. Within the last 6 months, we have seen demand destruction from pension-fund de-risking, forced selling from basis trades unwinding, and absorption concerns from excessive government spending.
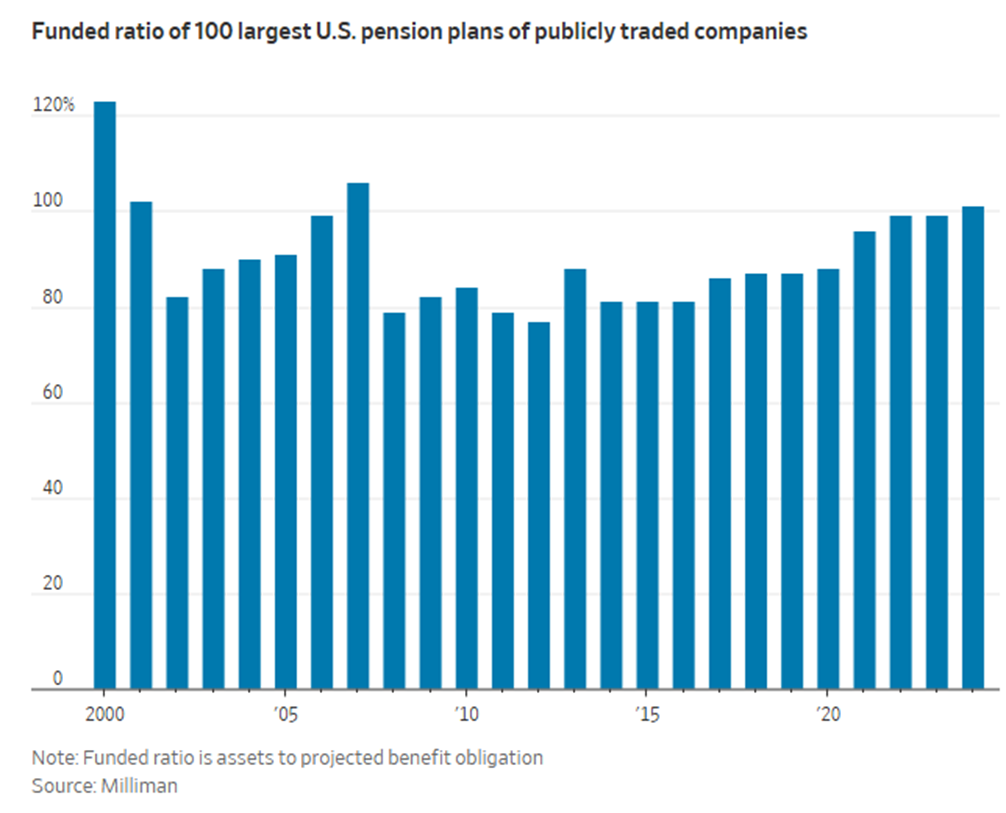
On the demand side, corporate defined benefit pension funds have hit over 100% funding for the first time since 2007. While normally this may not change behavior, many of these corporate plans have shifted new enrollments to defined contributions, meaning that they will have aging beneficiaries and no new enrollments to cover over the long-term. No longer having to target high-returns to catch up or maturity match longer timelines, many are steadily de-risking out of equities and the long-end of the curve as they prioritize liquidity.
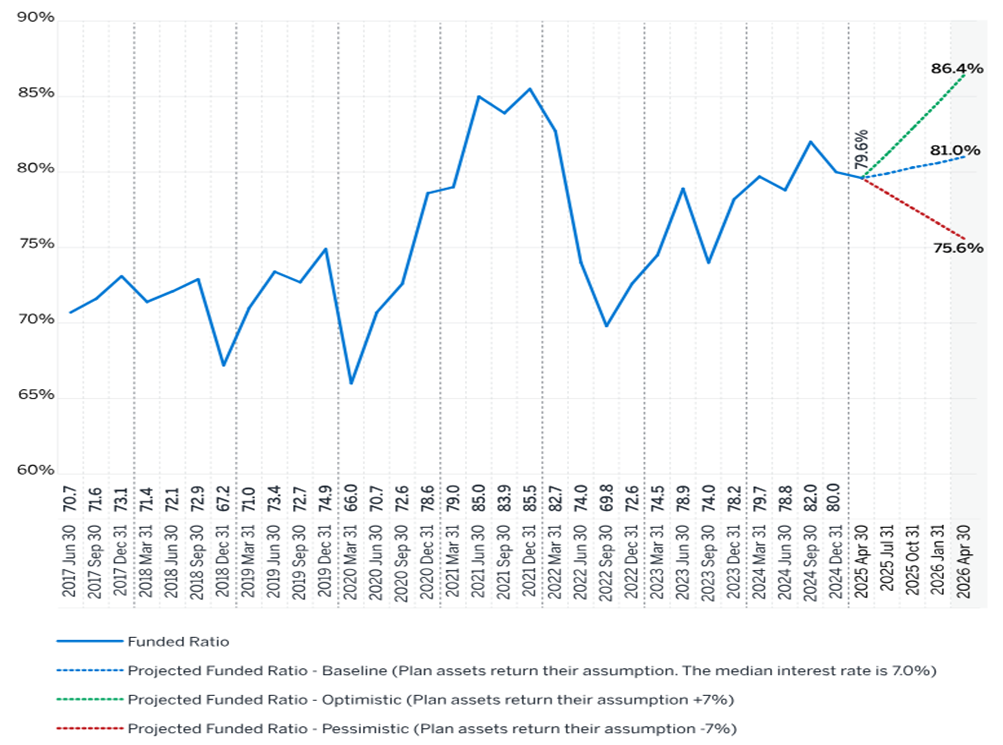
On the public pension side, the 100 largest public US pensions have climbed to 79.6% funded from 74.5% a decade ago. Above 80%, while not a hard actuarial rule, is generally used as an indicator for a pension with a stable path to being 100% funded over the long-term. To put it simply, even public pensions no-longer need to chase returns as aggressively.
According to Financial Times, Japanese institutional investors have dumped more than $20 billion in bonds since April 1st. As equity markets tumbled, portfolios fell out of balance forcing massive sell-offs of bonds to maintain legal compliance. On top of this, more than $800 billion in highly leveraged basis trade exposure faced margin calls forcing further liquidation of Treasuries. Traditional shock absorbers, like Japanese life insurance companies and banks, ended up becoming shock amplifiers.
Finally, the “Big Beautiful” budget will add around $700 billion per year to the deficit by 2027. Given much of the tax cuts and additional spending are front-loaded, more than $2.8 trillion in new debt would need to be issued by 2029 increasing interest expense by an estimated 34% compared to current law
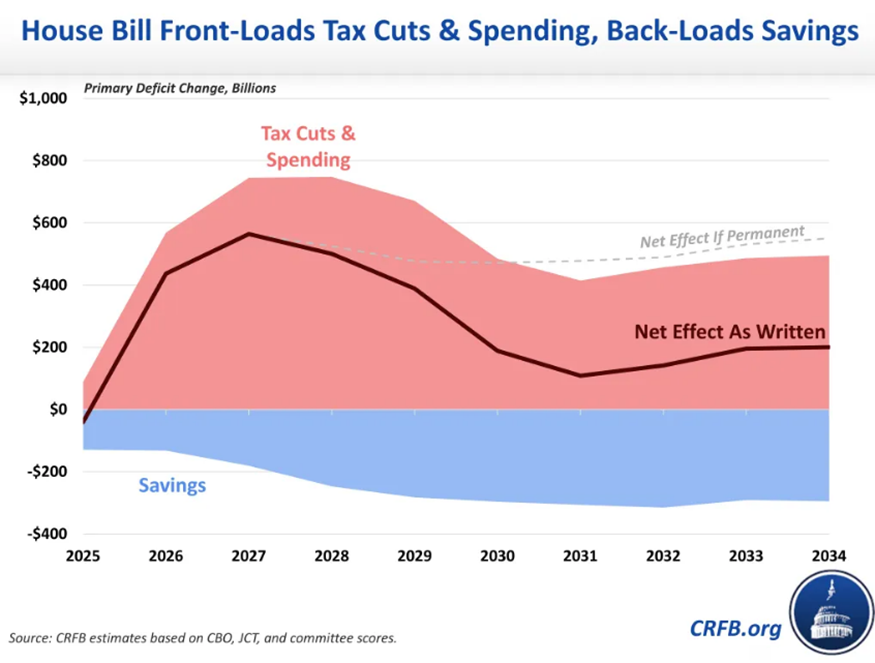
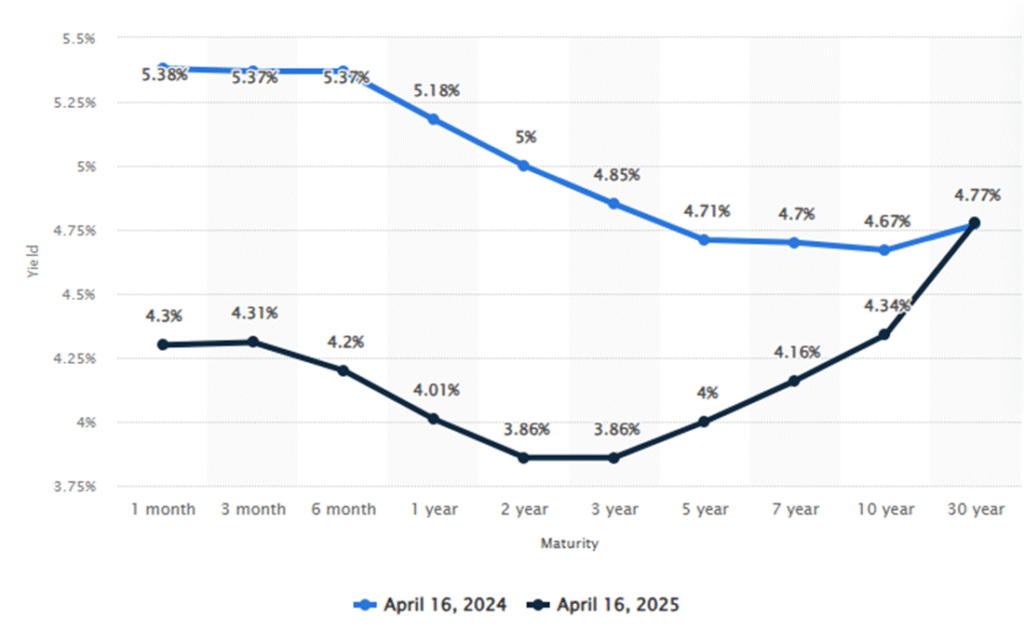
Markets have started pricing in a massive influx of new issuances over the long term. The first long-term Treasury auction since the introduction of the budget had very weak demand, with the bid-to-cover dropping to 2.46x from 2.78x at the beginning of the year and below the 10 year average of 2.58x.
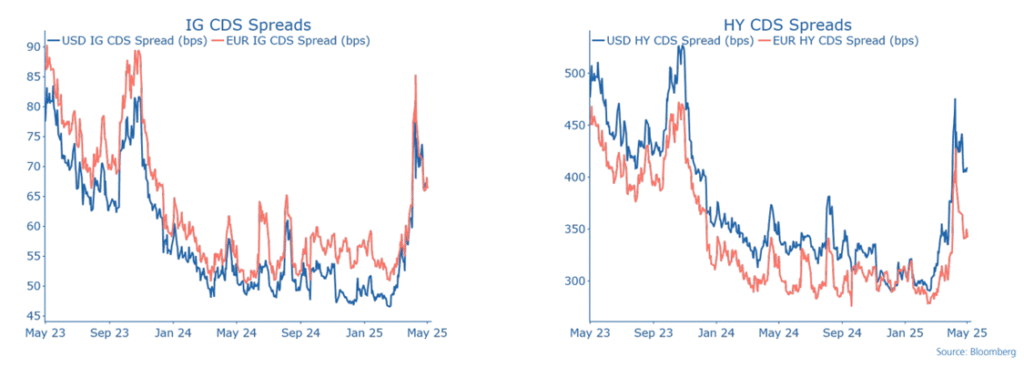
Finally, to finish off the month, Moody’s finally followed Fitch and S&P by downgrading the US’s debt from Aaa to Aa1 citing the rising deficit. While the impacts on the market of downgrades are usually minor (the lead up to what causes the downgrade is usually what moves markets), credit default spreads have risen to their highest level in nearly two years.
Businesses Starting to Feel Tariffs
| Index | Value | Direction |
| Aggregate | 48.5 | Contracting Faster |
| New Orders | 47.6 | Contracting Slower |
| Total Backlog | 47.1 | Contracting Slower |
| Production Output | 45.4 | Contracting Slower |
| Employment | 46.8 | Contracting Faster |
| Customer Inventories | 44.5 | Contracting Faster |
| Prices | 69.4 | Increasing Faster |
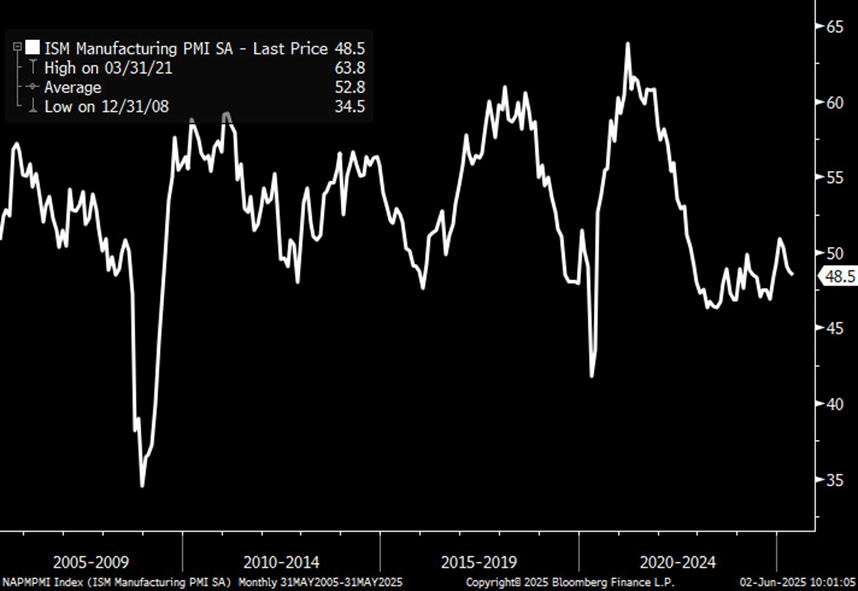
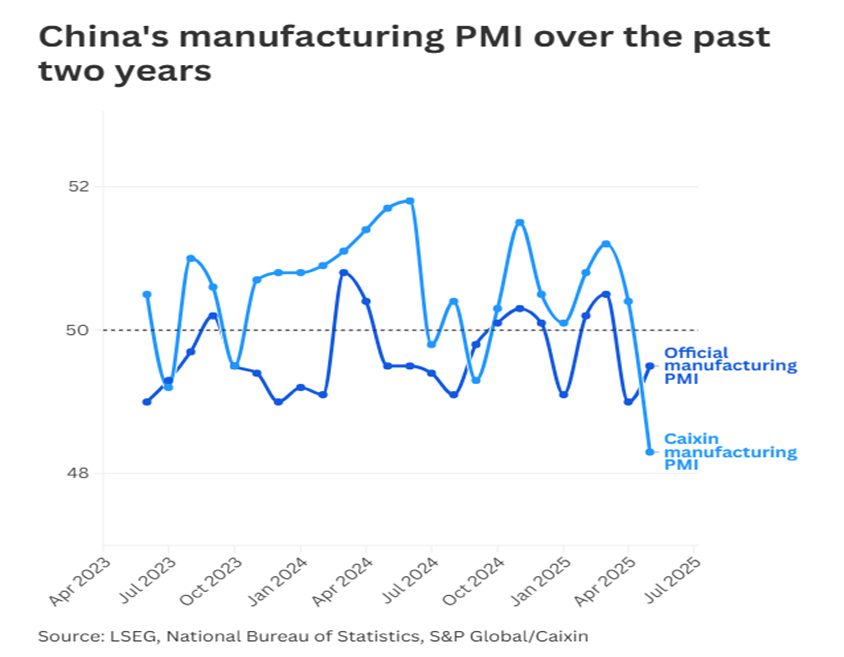
US PMI (Purchasing Manager’s Index) for the manufacturing segment came out marginally worse than expected at 48.5 – the third straight month of contraction. Unsurprisingly, imports are down to their lowest level since 2009 at 39.9. Any level over 50 indicates an expansion of the manufacturing sector. Conversely, China’s manufacturing PMI fell to 48.3 from 50.4, the worst result since early 2022 as US tariffs began to hit export orders there.
Despite some retailers saying they are willing to absorb cost, there is very little indication that manufacturers are willing to absorb any of the cost of tariffs which may limit the actual impact of the already narrow-margined retail’s ability to absorb the impacts to end consumers. Given Trump announced a doubling of aluminum and steel tariffs to 50% on May 30th, it is likely further price increases are on the way.
According to a respondent in the transportation industry, there is a continued softening for the demand of commercial vehicles, which is downwind of both the expected decrease in shipping volume over the medium term and price increases as vehicle manufacturers attempt to preserve margins.
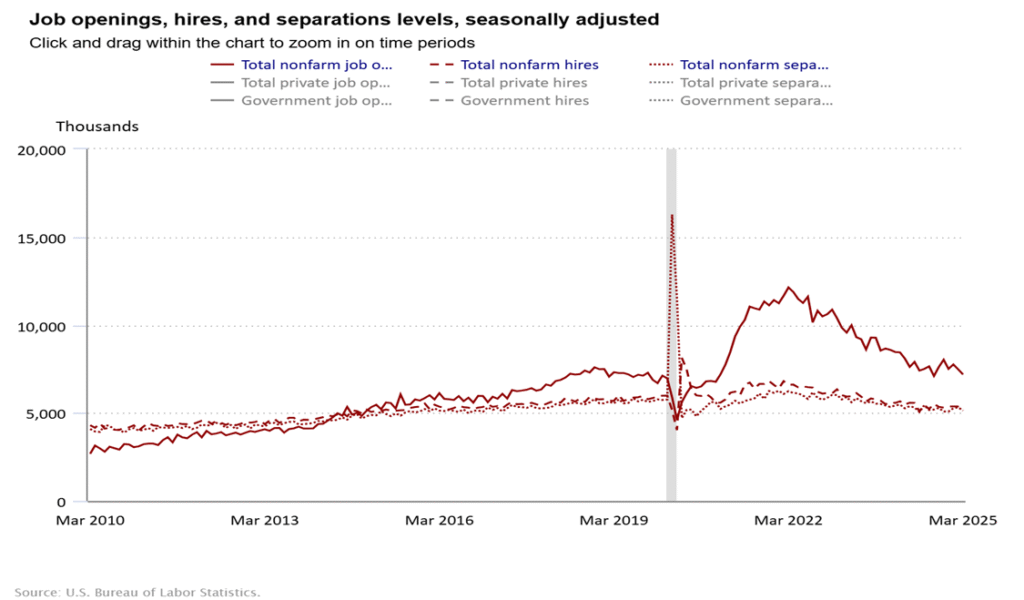
In the electronics sector, respondents highlighted that government delays on funding distributions or cuts to programs entirely have amplified the unwillingness to take on inventory risk which has heightened supply chain disruptions. Outside of manufacturing, the JOLTs report indicates that it is getting more difficult to find a job after losing one. Most analysts believe that the number of created jobs and those employed is likely overstated, as laid off employees still collecting severance are still considered employed under the survey.
The Real Tariff Winner So Far: India
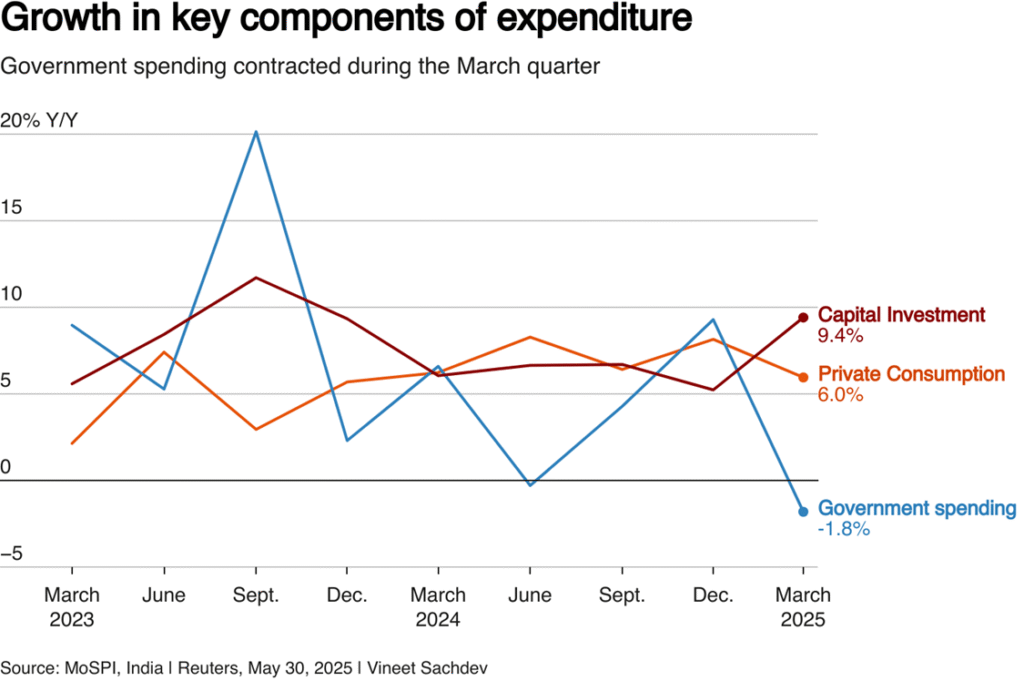
Despite some geopolitical risks flaring with the short-lived India-Pakistan conflict, for the quarter ending March 2025 India’s economy grew 7.4% year over year compared to estimates of 6.7%. Despite consumer spending easing to 6% growth compared to 8.1% for the quarter ending December 2024, a broad gain in manufacturing output, which rose 4.8% year over year, and construction activity jumped 10.8%, boosting GDP.
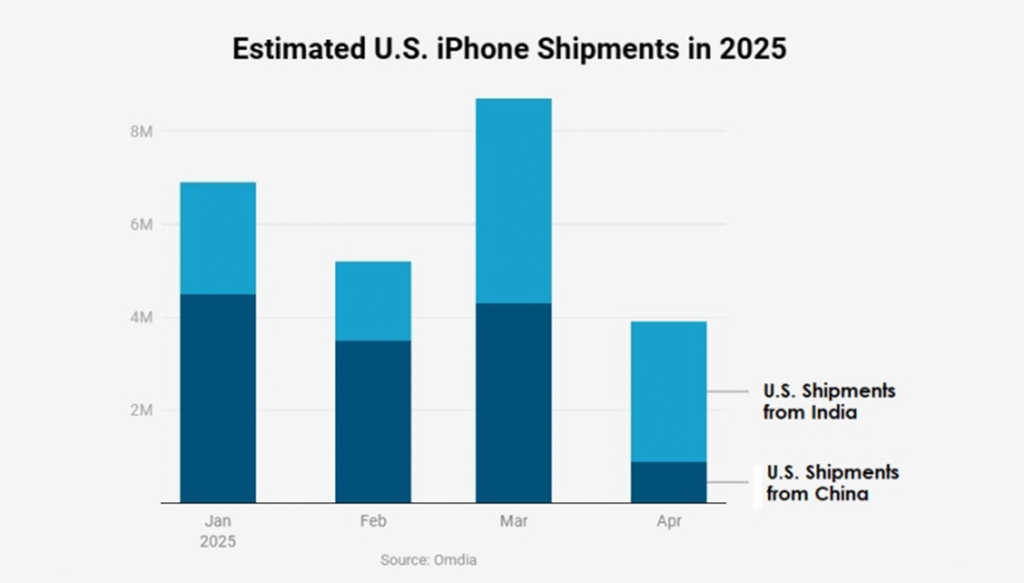
Some of the largest jumps in exports are $1.3 billion in additional iPhone exports to the US. Broadly, March 2025 set a record for the most US smartphone imports, rising 30.1% year over year. Apple indicated that it would be aggressively repositioning production to India, hoping to double output by 2026 to meet the US’s total 84 million annual unit demand.
The continued trend will likely depend heavily on how far the US and China roll back trade talks, and if the 26% tariffs on Indian exports taking effect on July 9th will be delayed again. As discussed in the intro, on May 13th it was announced that there will be a 90 day tariff reduction agreement to lower tariffs on Chinese goods to 30% from 145%, and China will lower tariffs on US goods to 10% from 125%. An additional exemption for certain electronics, making up 29% of US imports from China until late August.