Economic and Market Review
July 1, 2025
| Equity Indices | YTD Return |
| Dow Jones | 5.44% |
| S&P500 | 5.38% |
| NASDAQ | 5.80% |
| SPDR Developed World Ex-US | 18.63% |
| MSCI–Emerging | 15.35% |
| Bonds (Yield) | |
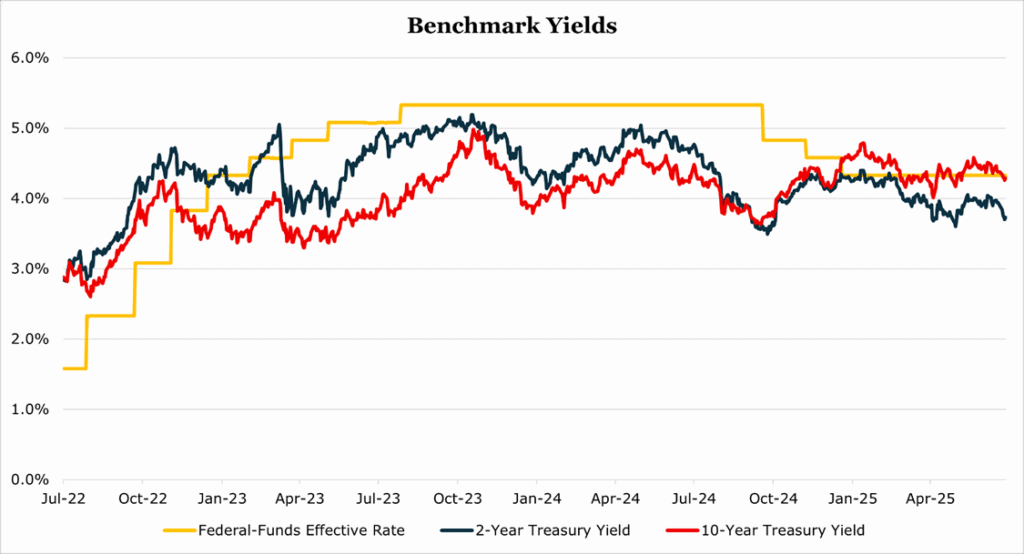
| 2yr Treasury | 3.79% |
| 10yr Treasury | 4.29% |
| 10yr Municipal | 3.19% |
| U.S. Prime Rate | 7.50% |
| Commodities | |
| Gold | $3,352.09/oz |
| Silver | $36.53/oz |
| Crude Oil (WTI) | $67.46/bbl |
| Natural Gas | $3.49/MMBtu |
| Currencies | |
| CAD/USD | $0.74 |
| GBP/USD | $1.36 |
| USD/JPY | ¥144.62 |
| EUR/USD | $1.18 |
Overview
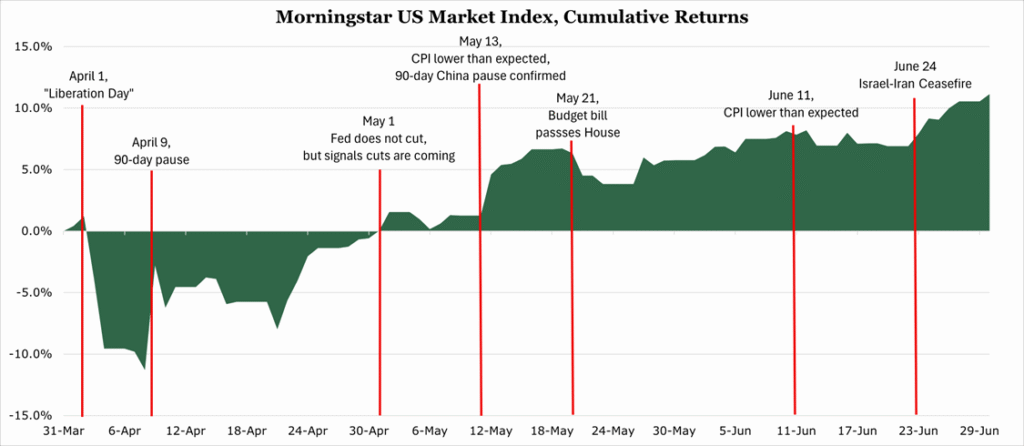
Equity markets have recovered more than 20% from April’s downturn. However, the market appears to be somewhat stalled, up just 5.7% year to date, with most of that occurring in the latter part of June thanks to the Israel-Iran ceasefire.
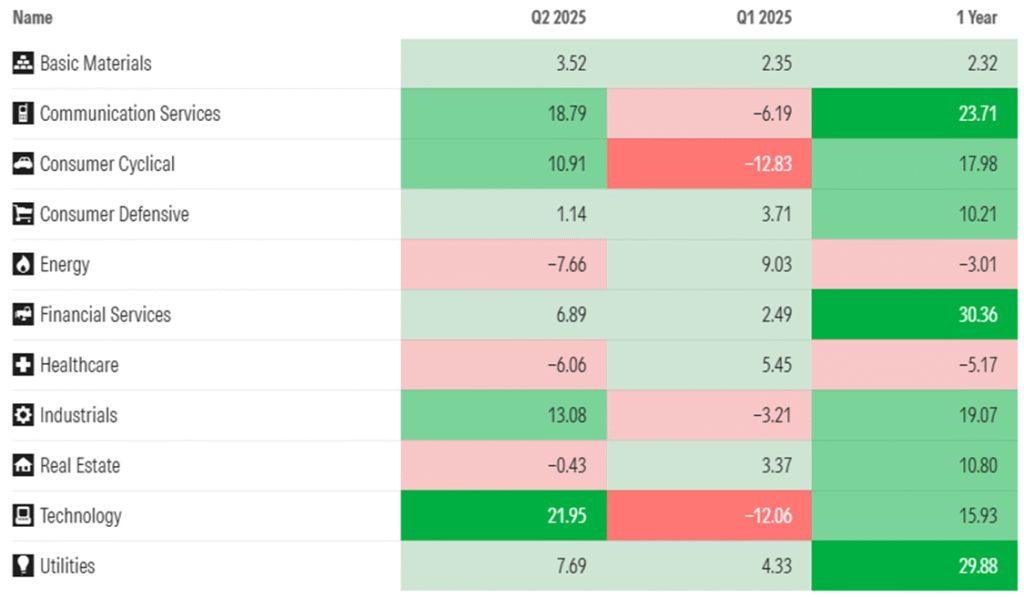
According to Morningstar, the biggest recovery came from tech, where it returned 22.0% in the second quarter after falling 12.0% during the first quarter.
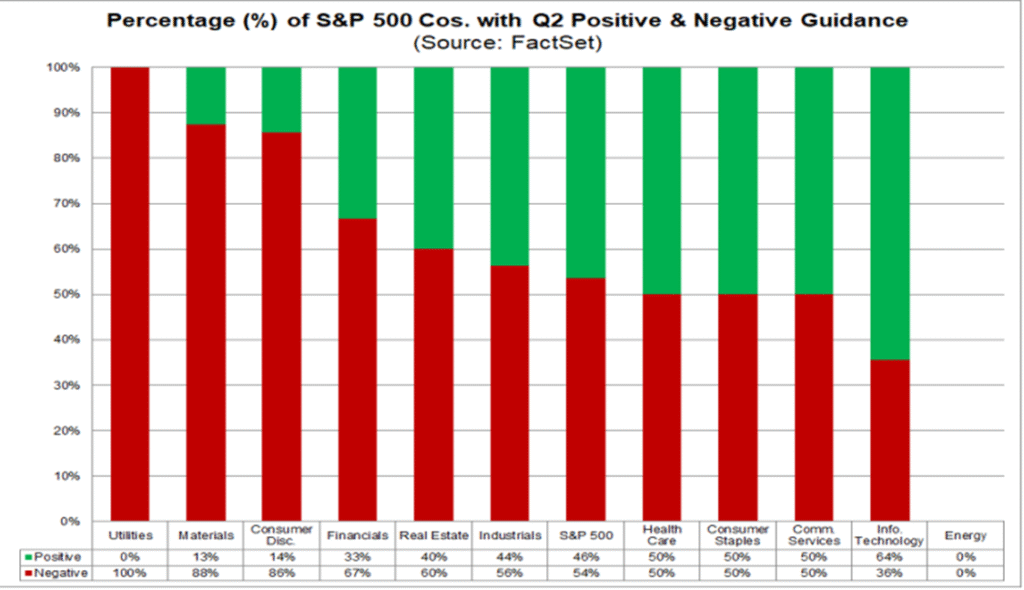
S&P 500 companies have delivered 13.0% earnings growth during the quarter ending March 2025 according to FactSet, though guidance for the second quarter has begun to turn negative, especially for trade sensitive industries such as materials and consumer discretionary segments.
The Fed once again chose not to cut during June, stating that Tariffs have changed the calculus for how the Fed will choose when to cut rates. According to a Reuters poll of 105 economists, 55% said the first rate cut would come in September, with 42% expecting either no cuts until October or later or no cuts at all. What was the majority opinion is that 80% state that the Fed Funds Rate will not fall below 3.75% during 2025.
Political Pressure Mounts on the Fed
PCE (personal consumption expenditure) increased in line with market expectations, coming in at 2.3% year over year. However, core PCE with food and energy costs increased 10bps above expectations to 2.7%. Core PCE is the Federal Reserve’s preferred metric when deciding to cut interest rates.
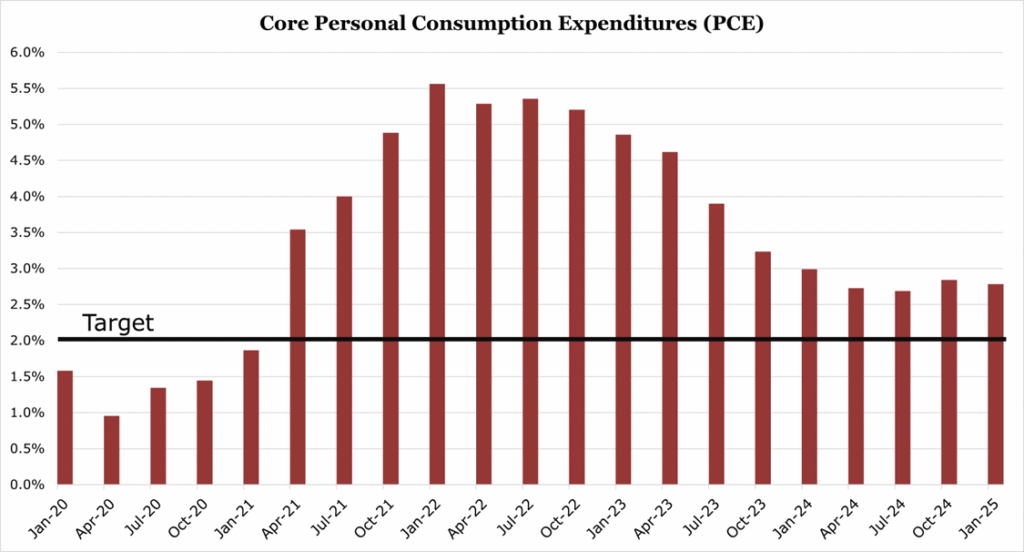
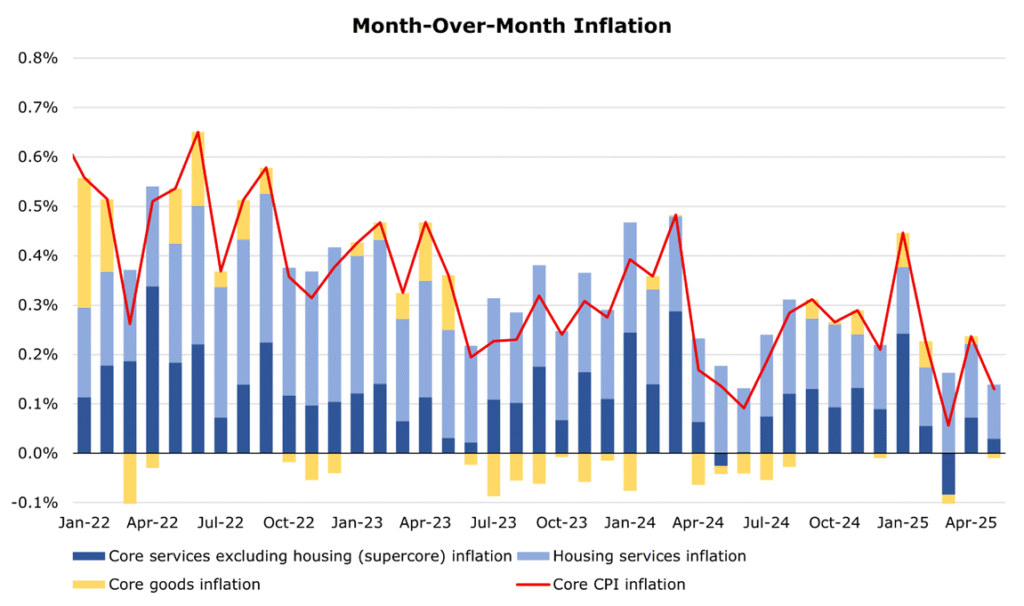
Despite PCE still running above target and above expectations, core CPI (consumer price inflation) rose by 0.1% month over month, below expectations. While forecasts had priced in tariffs impacting prices immediately, it appears that they were not as present as feared with annualized core inflation only rising 2.8% for the third straight month.
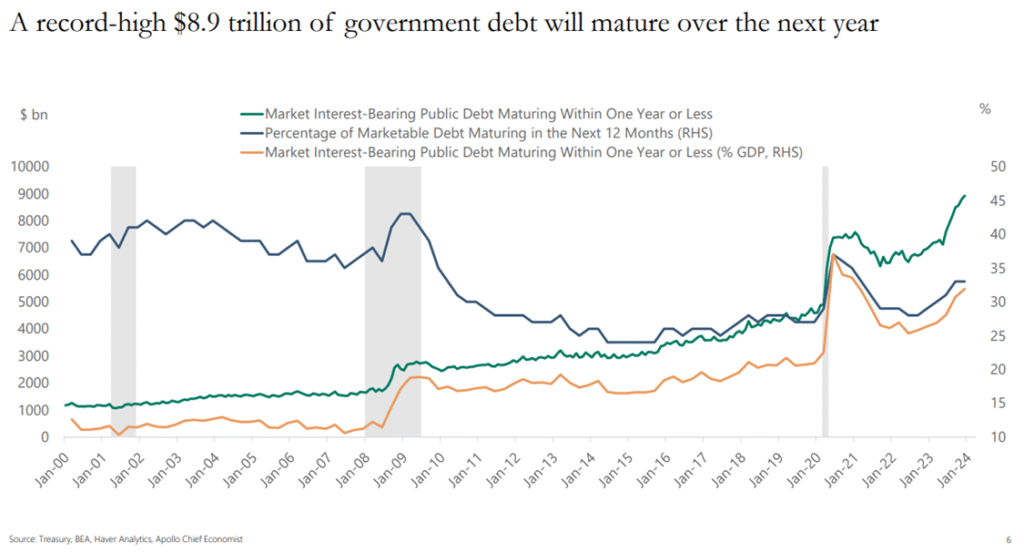
Despite the still elevated reading, Trump renewed attacks on the Fed, demanding rate cuts. In an open letter to Fed chair Powell, Trump stated that Powell was costing America “hundreds of billions of dollars” in interest payments. Trump is hoping to pressure the Fed to cut rates before the Treasury must refinance $8.9 trillion in debt by the end of the year. The $8.9 trillion “maturity wall” represents nearly 1/3 of all treasuries currently outstanding and the equivalent of 30% of US GDP.
Despite Powell’s term extending to May 2026, Trump has signaled that he may appoint a “shadow” chair before the term expires, with the administration emphasizing they would be choosing a candidate who wants to cut rates. The two named potential candidates are Treasury Secretary Scott Bessent or former Fed board member Kevin Warsh. We discussed Bessent late last year here. Historically, Warsh was an outspoken opponent of quantitative easing and is a deficit hawk.
The ”One Big Beautiful Bill”
On July 1st, the One Big Beautiful Bill Act passed the Senate and was sent back to the House for a final vote.
One of the most consequential for investors is the modification of bonus depreciation provisioning and R&D expensing, which may provide a boost to the bottom line of R&D-intensive or PP&E intensive industries. Under current law businesses may only deduct 40% of the purchase price of qualifying assets in their first year. The new bill adds 100% first-year depreciation bonus. According to a 2022 study, this will boost long-run economic output by 0.4%, and support 73,000 jobs – though it would reduce federal revenue by $400 billion over 10 years. For R&D, expenses must be capitalized and amortized over a 5-year span. The new bill offers a choice of immediate deduction, amortization over the useful life of research, or amortize over 10 years.
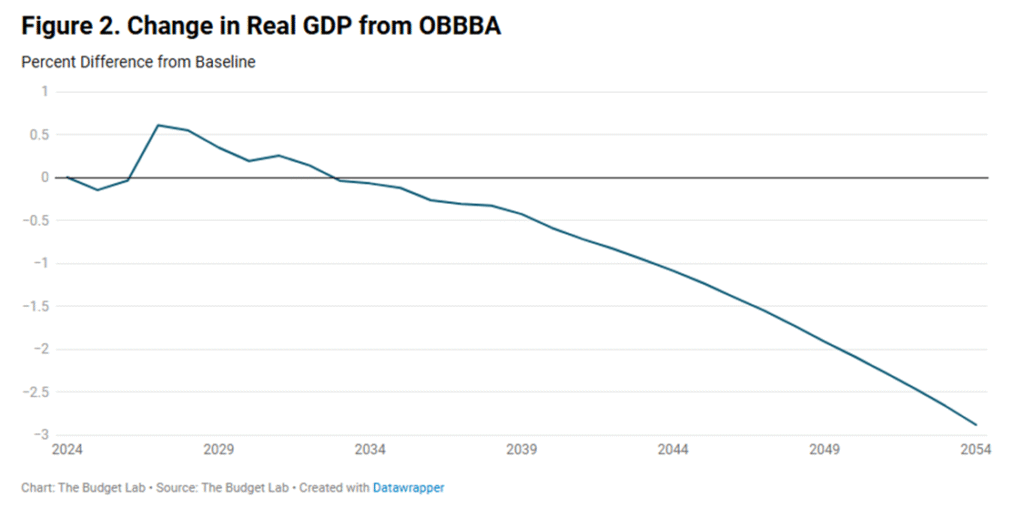
While the extension of tax-cuts and favorable tax treatment of business expenditures will likely boost GDP over the medium term, by 2054 real GDP will be 2.9% lower than the baseline. The reason behind this is high deficit spending causing higher-for-longer rates, which are an inherent drag on consumer spending and business expansion. Additionally, government spending will be slowly siphoned away from infrastructure and expansionary spending toward debt service.
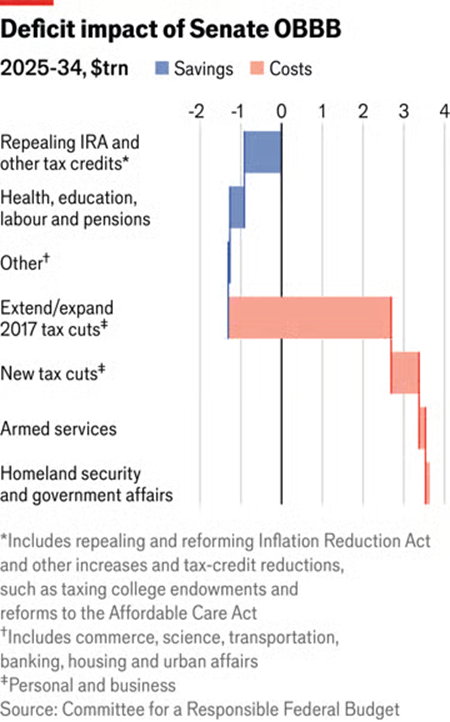
The bill adds just over $3 trillion to the national debt by 2034, spiking debt to GDP from the initially forecasted 117%, to 130%. Overall yield impact to 2034 according to the CBO is an average increase of 14bps on the 10 year Treasury, with Yale budget lab projecting 30bps. While both seem small, it would represent the largest yield impact from fiscal policy since 1981 and spike interest payments as a percentage of GDP to 6.0% from its current 3.0%.
The combination of $3 trillion in additional debt, rising Treasury yields, and deteriorating credit ratings on US debt signals the end of the era of abundant, cheap government financing that has supported asset valuations for over a decade.
Private Payrolls Come in Cold
According to ADP, private payrolls fell for the first time in two years in June, with the US economy contracting 33,000 jobs in June. Forecasts were at an increase of 95,000, following a 37,000 gain in May.
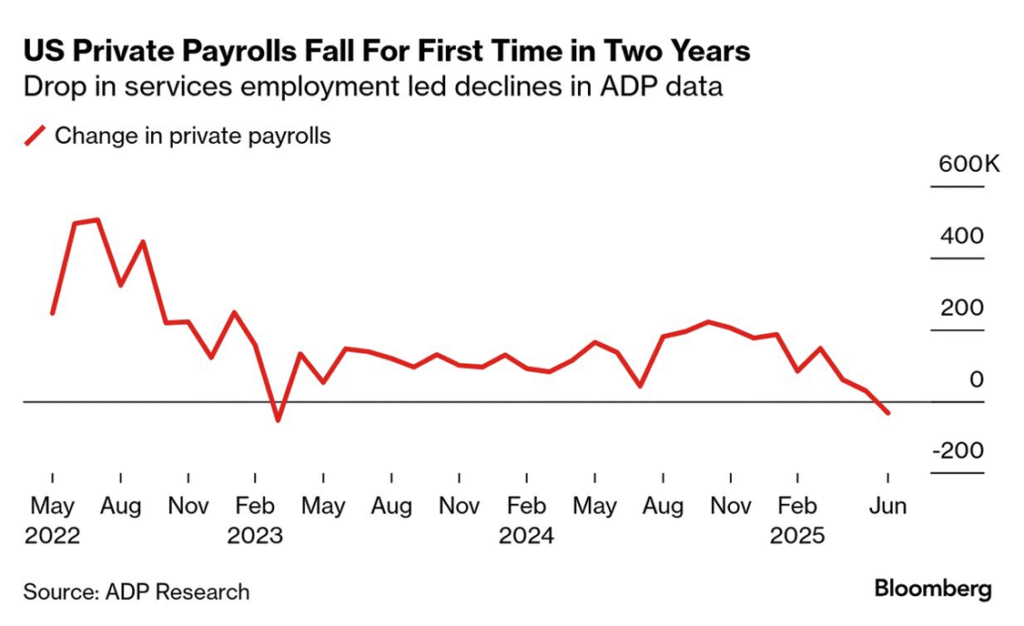
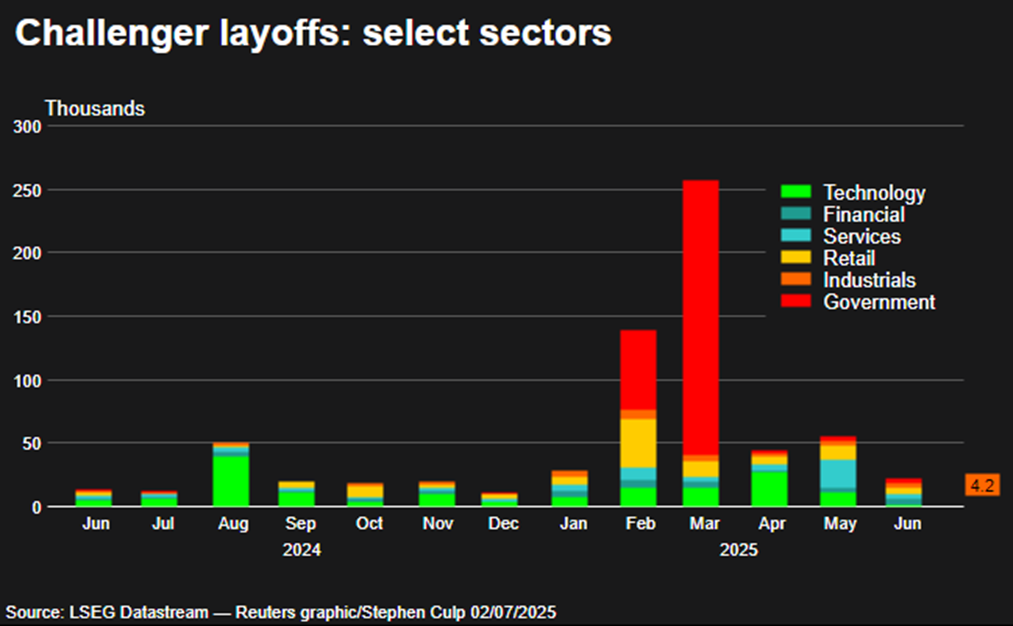
It is important to note that the ADP report is not commonly used for its minutiae as it is historically inaccurate on specific numbers. However, it is commonly used by economists as a barometer for if the more reliable BLS survey will come in above or below expectations. According to Challenger, Gray & Christmas, the number of layoffs during the second quarter declined 50% from the first quarter, but the number of planned hires also dropped substantially indicating business are still wary on expansionary spending.
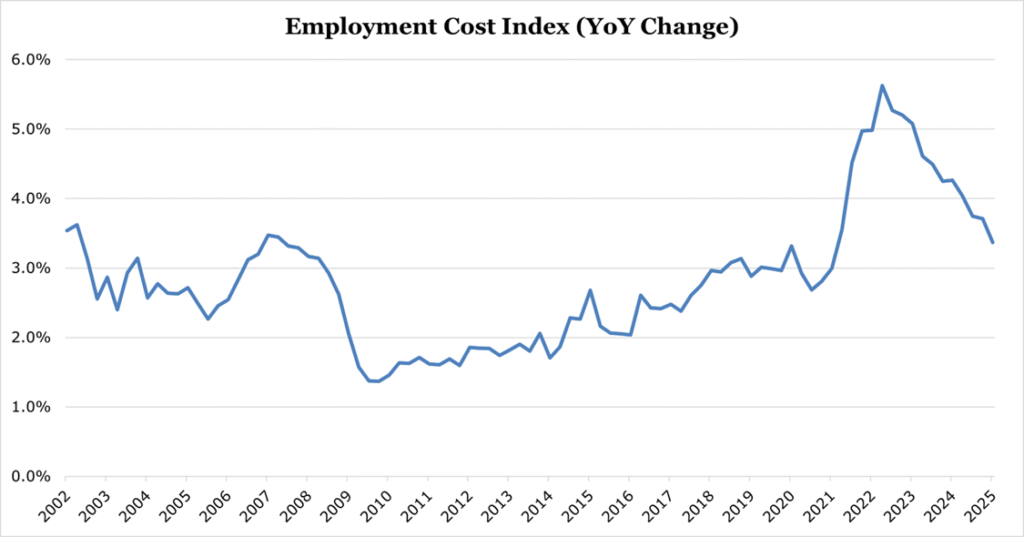
On the positive side for business conditions, the employment cost index published by the BLS remained cool in the first quarter of 2025, with salary increases slowing to just 0.9% year over year, with the total index increasing 3.4% year over year.
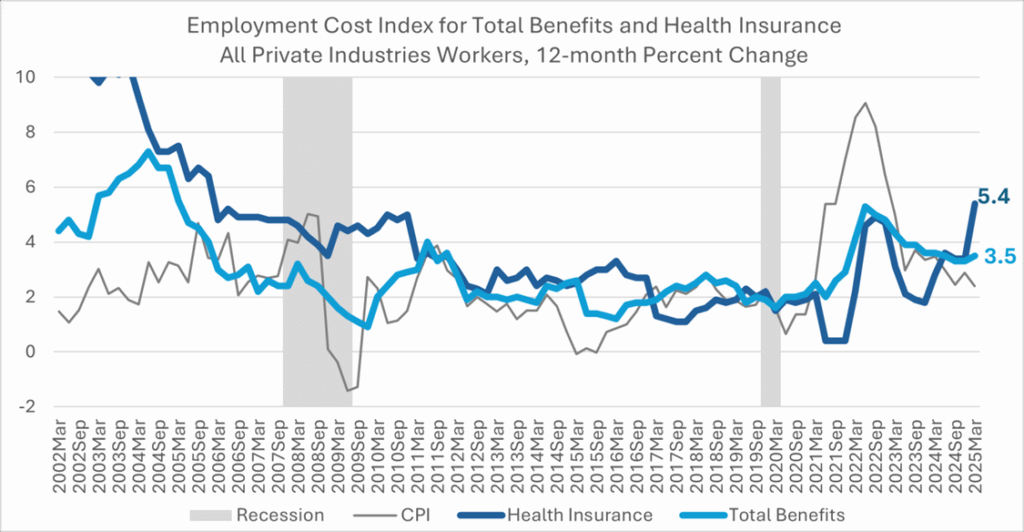
Specifically health benefits, have continued to increase, accelerating to 5.4% year over year for the quarter ending March 2025 compared to the total cost of benefits which increased 3.5% year over year.
Oil Prices Have a Volatile Quarter
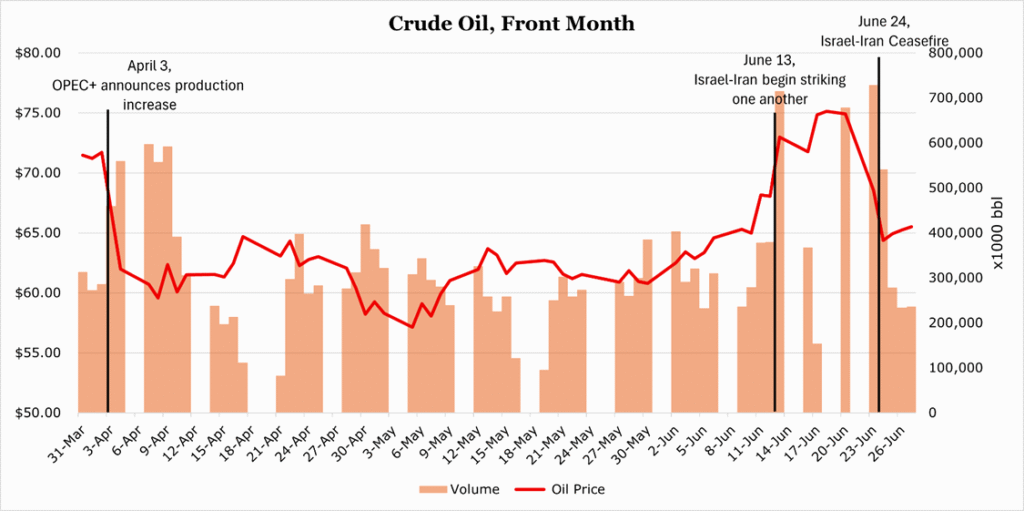
Crude oil had a volatile quarter, beginning with OPEC+ announcing they would ditch gradual production increases and instead allow for an extra 400,000 bbl/d from its 8 members in May. In June with tensions between Israel and Iran exploding, oil spiked back above $70/bbl. However, by June 24th, both parties had agreed to a ceasefire bringing oil back down to the mid $60s.
Some analysts expect oil prices to creep back up to the $70 range through the year as US oil stocks have declined 9% below the 5-year average, with diesel stocks 21% below average.
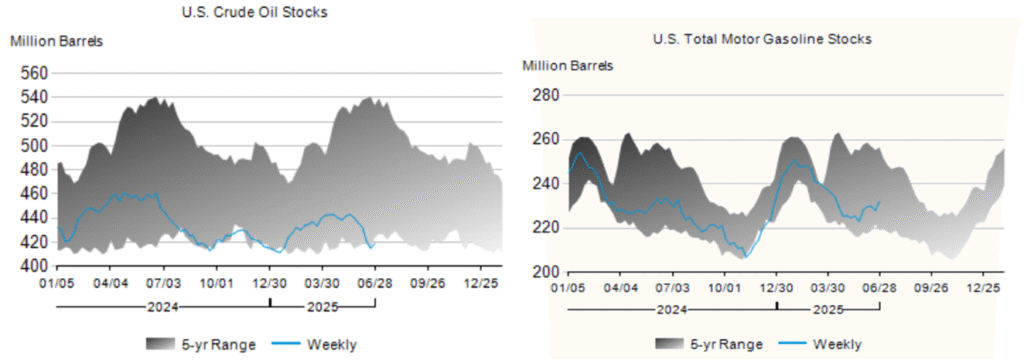
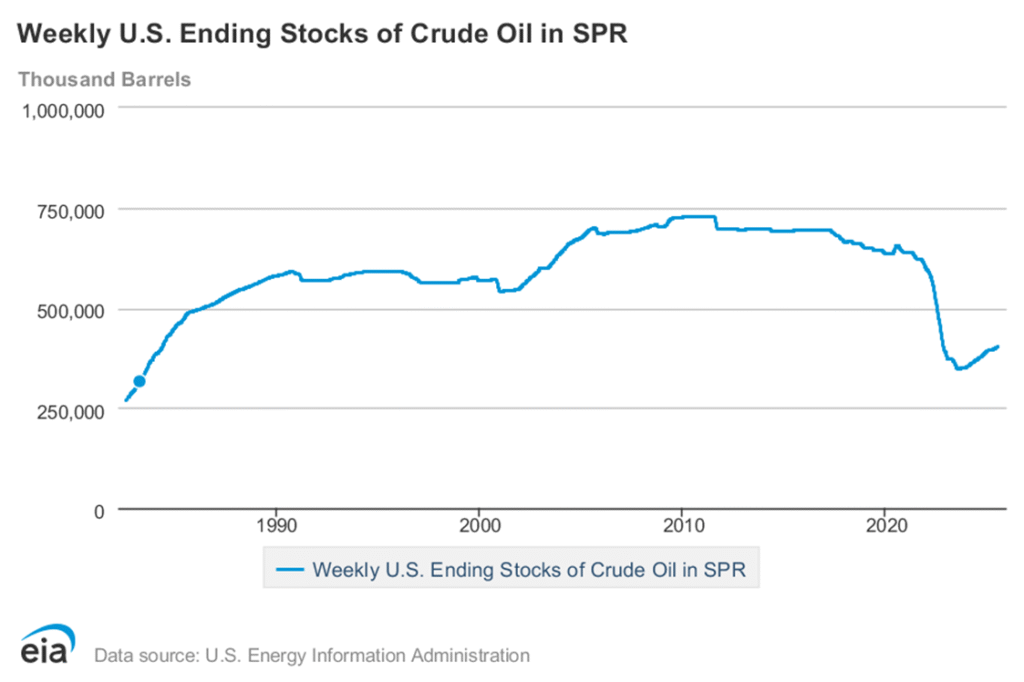
of the latest inventory report on June 27th, despite crude inventories continuing to fall, refineries are running near-capacity (95.0% capacity) with a build in gasoline stockpiles. Despite this refined product build, US oil imports are still down 13.9% year over year with overall consumption down 1.1% year over year. The private American Petroleum Institute figures published on July 1st show a 680,000-barrel increase in crude stocks, compared to the analyst expectations of a 2.3-million-barrel draw. Despite being far above expectations, the market appears to still broadly be pricing in support from the Department of Energy’s slow build of the Strategic Petroleum Reserve, continued trade progress, and optimism regarding summer demand trends.