Economic and Market Review
July 31, 2024
| Equity Indices | YTD Return |
| Dow Jones | 5.05% |
| S&P500 | 12.11% |
| NASDAQ | 12.82% |
| MSCI – Europe | 6.36% |
| MSCI–Emerging | 7.49% |
| Bonds (Yield) | |
| 2yr Treasury | 3.9% |
| 10yr Treasury | 3.8% |
| 10yr Municipal | 2.65% |
| U.S. Corporate | 5.09% |
| Commodities | |
| Gold | $2,463.90/oz |
| Silver | $28.74/oz |
| Crude Oil (WTI) | $73.56/bbl |
| Natural Gas | $2.0/MMBtu |
| Currencies | |
| USD/CAD | $0.72 |
| USD/GBP | $1.28 |
| USD/JPY | ¥146.92 |
| USD/EUR | $1.09 |
Overview
The Fed left rates unchanged once again, though they stated that “some further progress” had been made toward the long-term inflation goal of 2%. However, it also emphasized that the economic outlook is uncertain, meaning the next few months are going to be critical for the Fed in deciding if it can squeeze a rate decrease before the end of 2024.
While the yield curve remains inverted for the longest period in history, the spread has begun to narrow with the Market considering a rate cut all-but-certain. This means that bond investors are holding more short-dated Treasuries, driving up yields on longer-term Treasuries.
Tech megacaps seem to be beginning to fall out of favor with investors, as earnings growth has begun to sputter relative to the lofty expectations. The “Magnificent 7” which have thus far led the S&P 500 saw around $2.1 trillion in market cap lost since earnings season began.
In oil markets, despite the lowest Asian crude imports in 2 years and falling manufacturing activity in China, the market is pricing in price increases by the end of the year. However, oil prices remain dampened as fears of weak demand outweigh fears over potential supply constraints.
Setting the Table for a September Rate Cut
Despite leaving rates unchanged at the July 31st meeting, the Fed stated that it had increasing confidence in the ability for it to cut during the next meeting on September 18th. The Fed typically tracks several metrics to determine if monetary policy needs to be tightened or loosened.
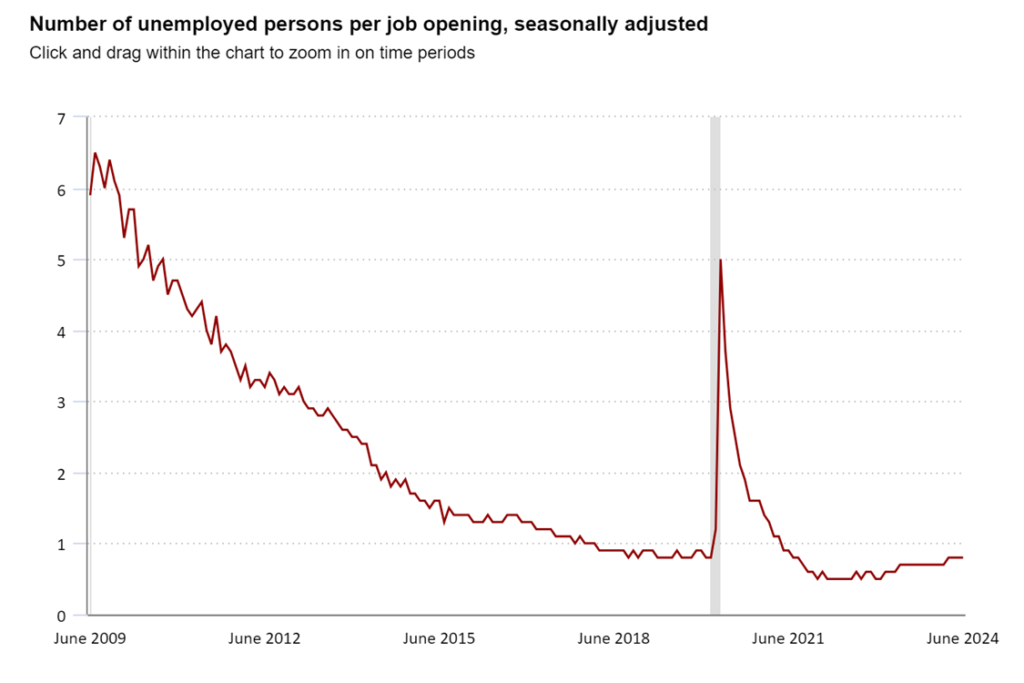
Unemployment is a common metric used, specifically the JOLTS survey. While both the unemployment rate and JOLTS have remained historically low, there is signs that the labor market is softening. The index increased to 0.8 unemployed persons per job, and the overall unemployment rate jumped to 4.3% from 4.1%.
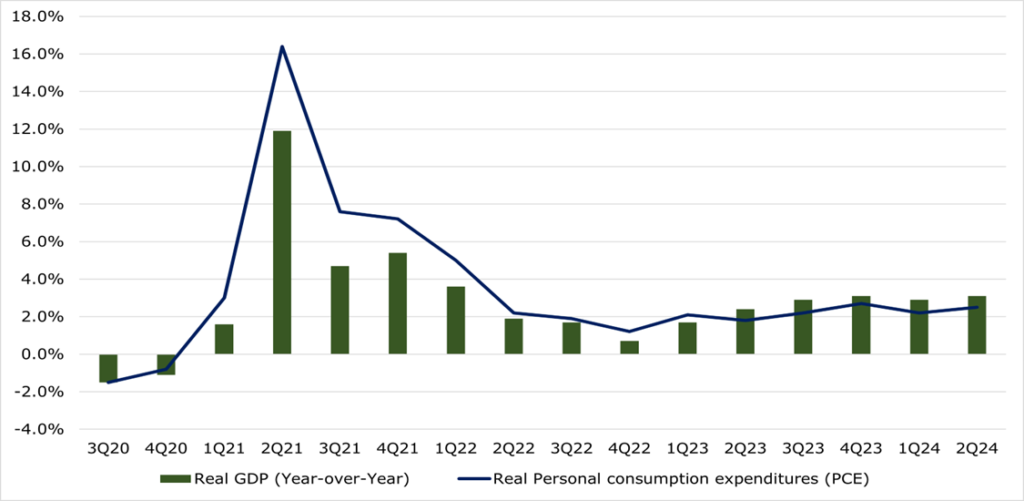
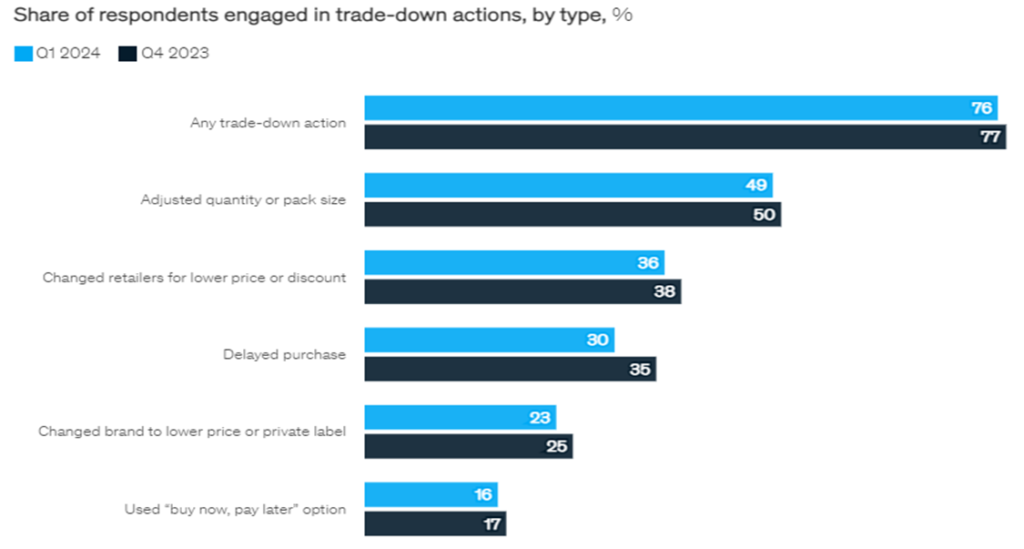
Real GDP was up 3.1% year over year with real personal consumption expenditures marginally up in the Quarter ending June 2024 to 2.5% year over year, compared to 1Q24’s 2.2%. Consumers overall have had a stable outlook, with the only change between late 2023 and the quarter ending March 2024 being fewer consumers delaying a purchase.
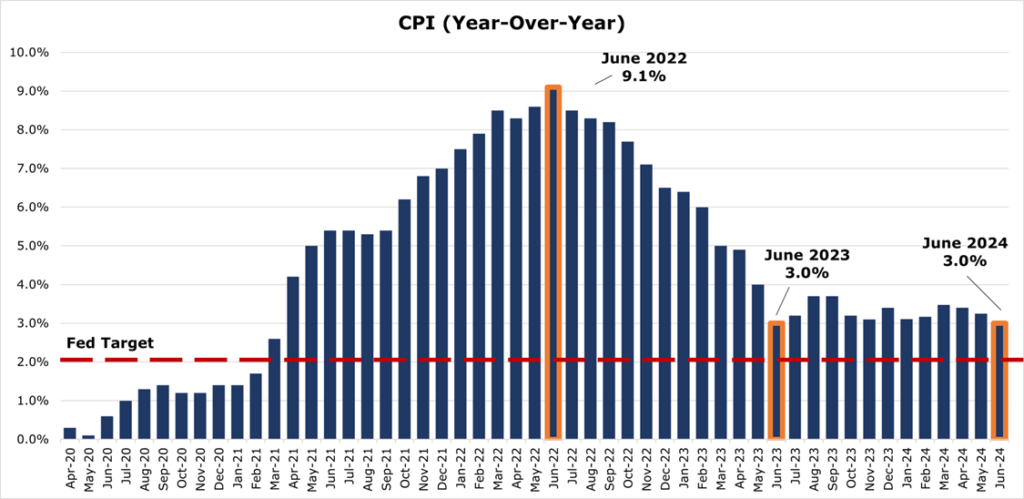
However, inflation continues to be sticky. The CPI continues to be stuck around 3.0%. Despite the improvement seen thus far, if inflation does not move down over the next few months, it is unlikely the Fed will cut more than once in 2024.
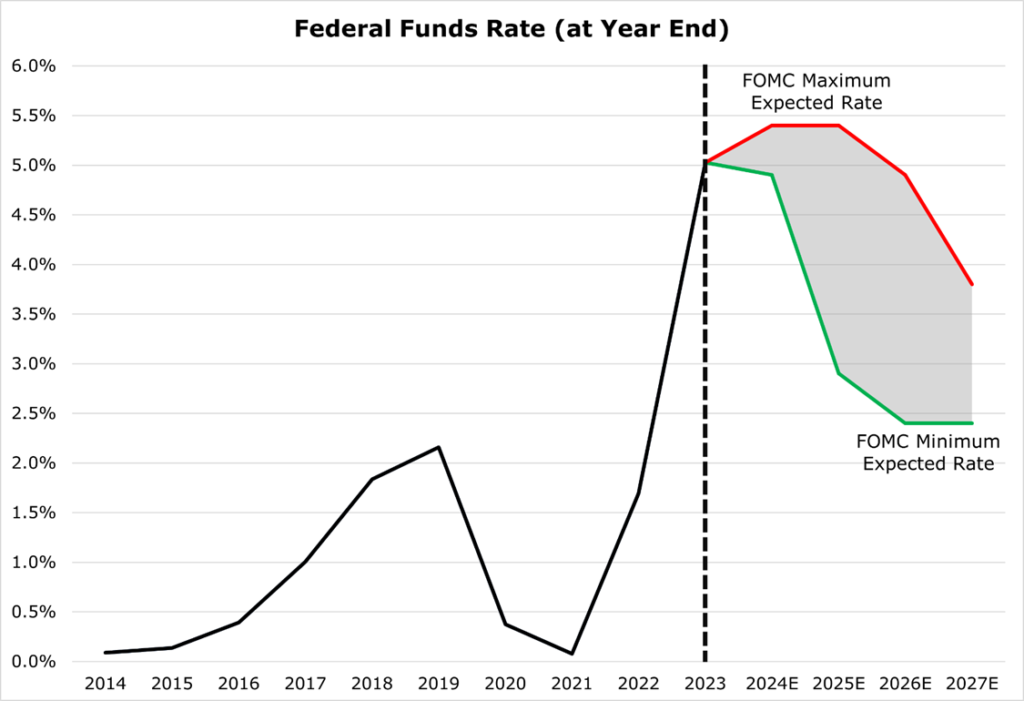
Overall, the Fed still seems pensive about the prospects of a substantial rate cut before 2025. While market is pricing in a year-end rate of 4.25% to 4.75%, as of the FOMC meeting in June 2024, the FOMC expect a year-end rate of 4.9% at the minimum.
Tightening Liquidity in The Treasury Market
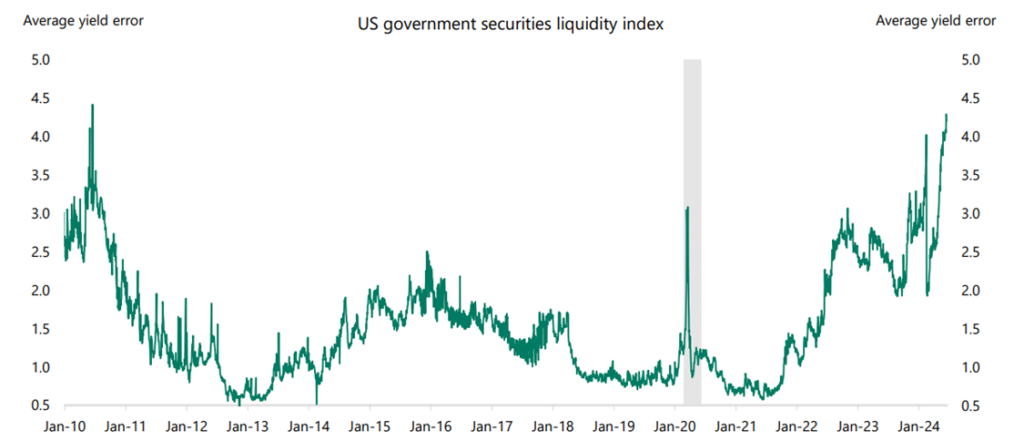
The index shows the average difference between the actual and expected yields of government bonds that have over 1 year to maturity. When the market is doing well and there are lots of buyers and sellers, these differences are usually small.
Recently, because of higher volume Treasury auctions and a growing government deficit, demand for Treasuries has been muted. Over the last decade, price insensitive buyers have grown their positions in Treasuries by 38.9%, while price sensitive buyers have grown by 76.4%. However, since 2020 price insensitive buyers have only grown their holdings by 4.1% — compared to the 23.6% growth of price sensitive buyers.
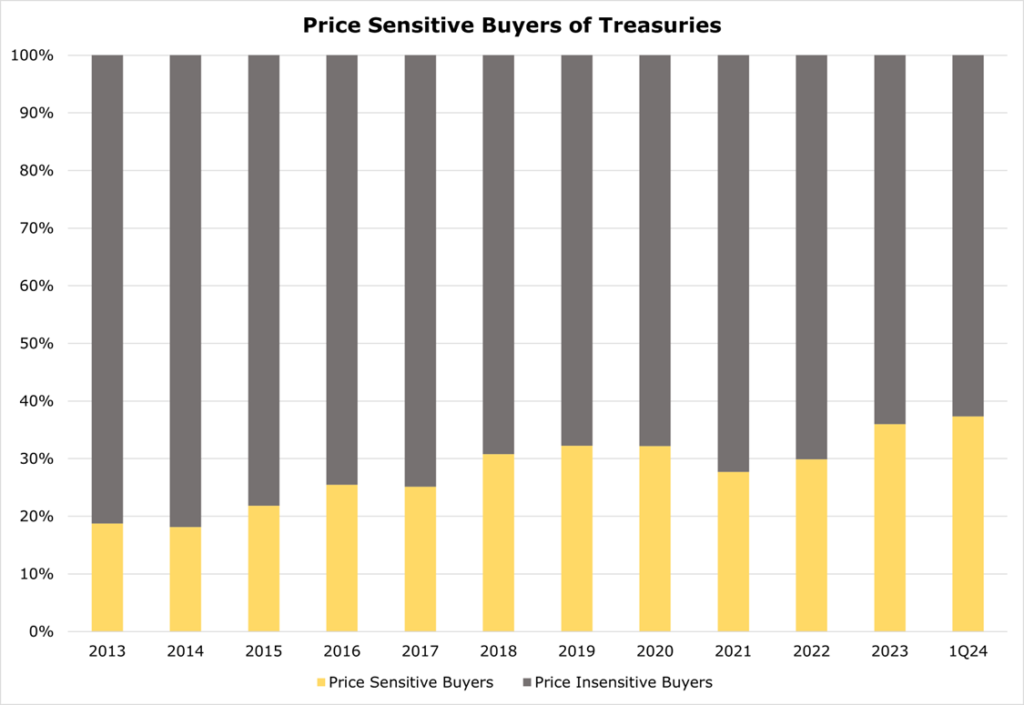
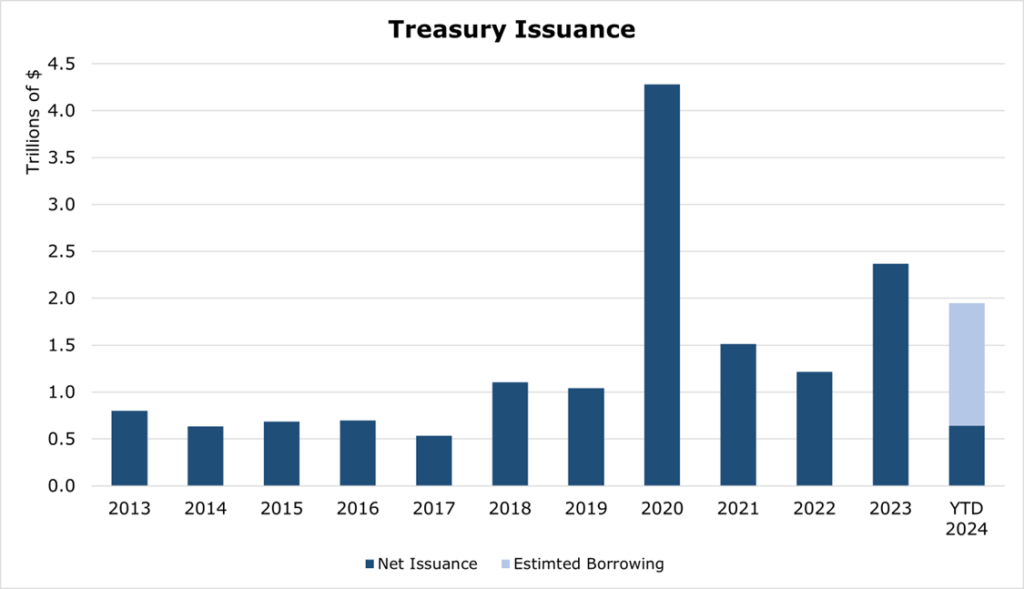
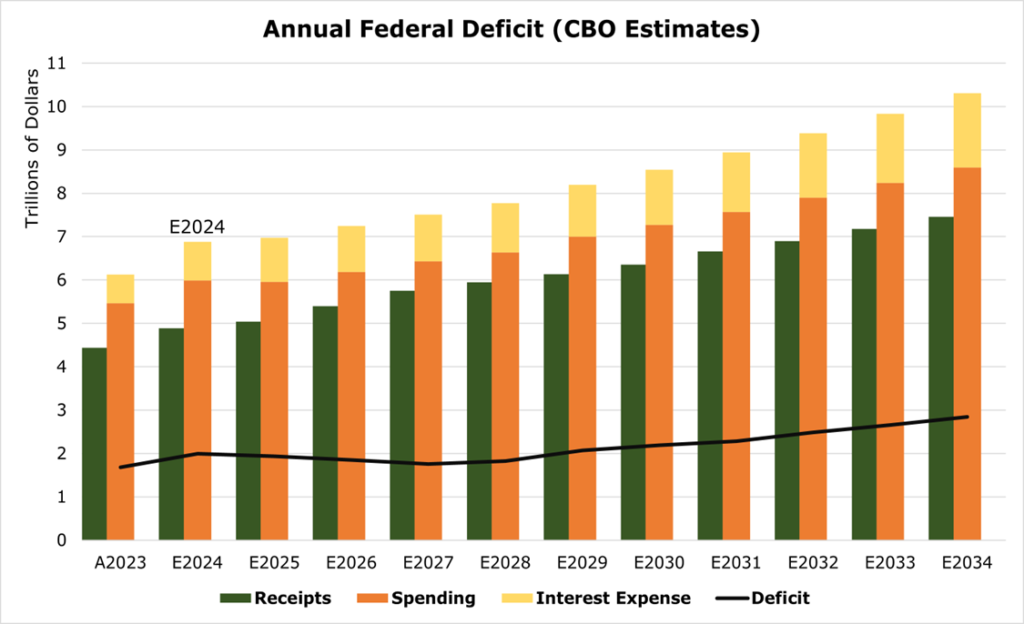
As this trend continues, the government will need to offer higher rates on issued Treasuries to attract buyers and thus increasing interest expense and the deficit, which will have a compounding effect on the deficit, future issuances, debt outstanding and thus interest expense.
Aggregate borrowing, and thus the deficit was revised up despite higher-than-expected tax receipts, with the Treasury department upping its total net borrowing estimates by $400 billion over the 2024-2026 timeframe, with an estimated deficit totaling $2.2 trillion by 2030. This likely understates the problem.
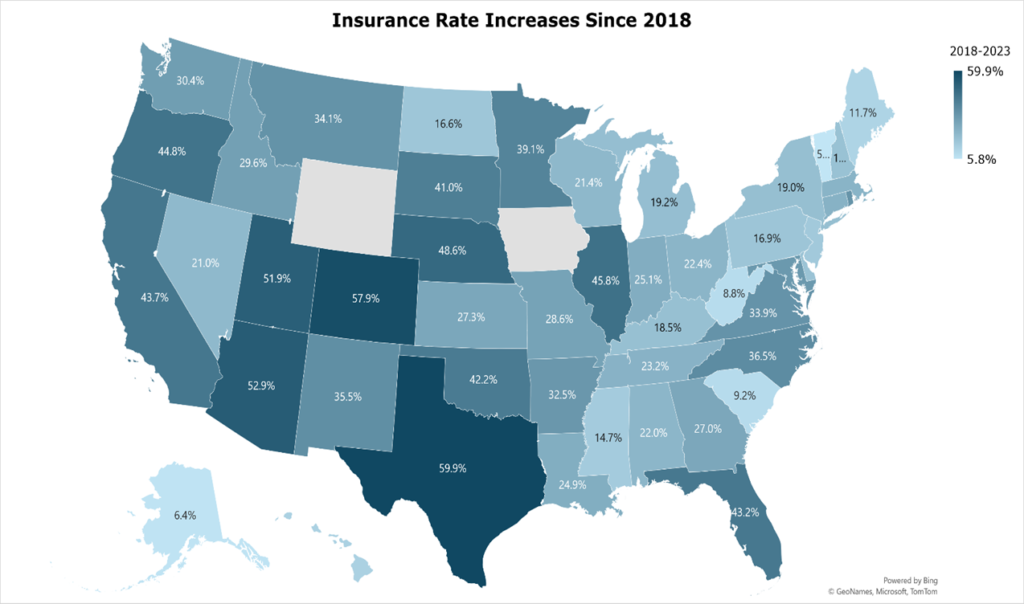
2023 Was the Worst Year For Insurers Since 2000
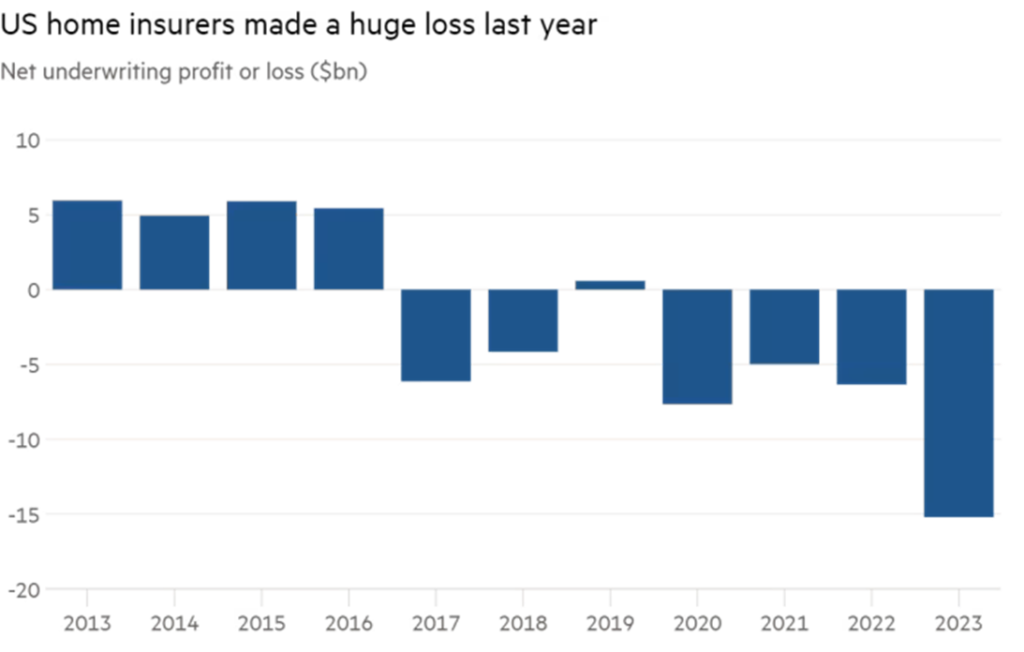
A mixture of extreme weather, inflation, rising home prices, and a population boom in the riskiest states have caused insurers to suffer a $15.2 billion underwriting loss according to AM Best. According to AON, during 2023 there was a record 37 catastrophic events (insurance losses over $1 billion), disturbingly above the average of 14 events. Globally, there was a record $118 billion in insured losses – 31% above the average since 2000.
Retirement Balances Have Not Kept Pace with Aging Population
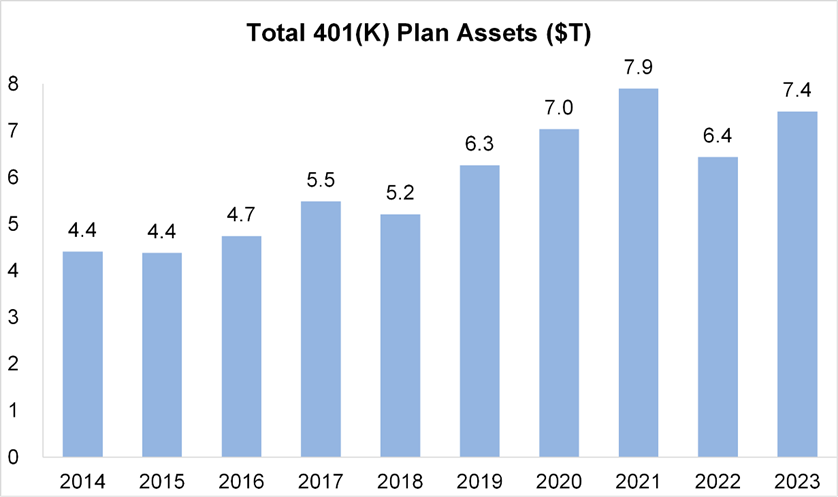
Despite booming equity markets the average 401k balance has not grown at the same pace as the population ages. This sets the stage for older individuals working far longer than historically.
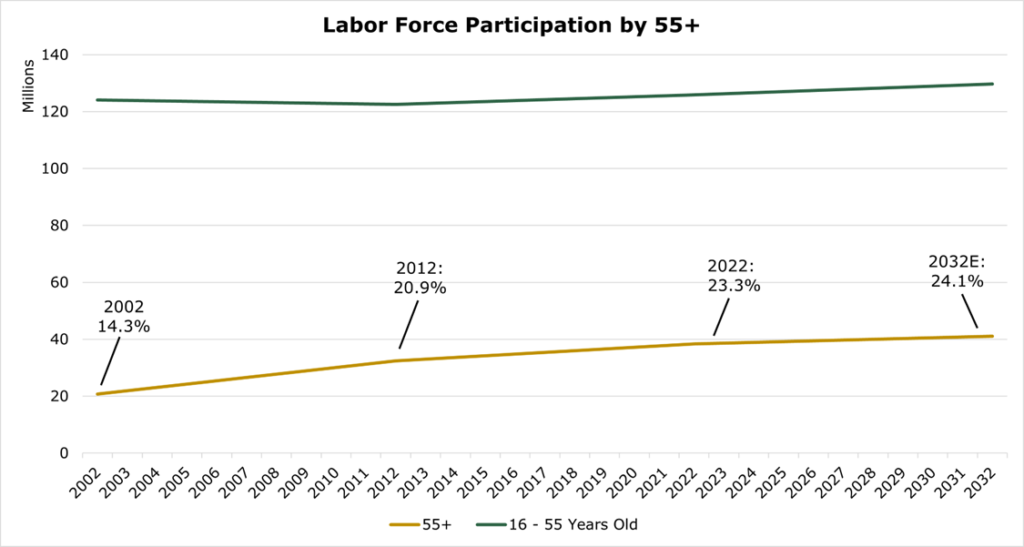
The BLS expects older workers to grow in share of total workforce, replacing younger workers who are increasingly waiting until their mid-twenties to begin a career.
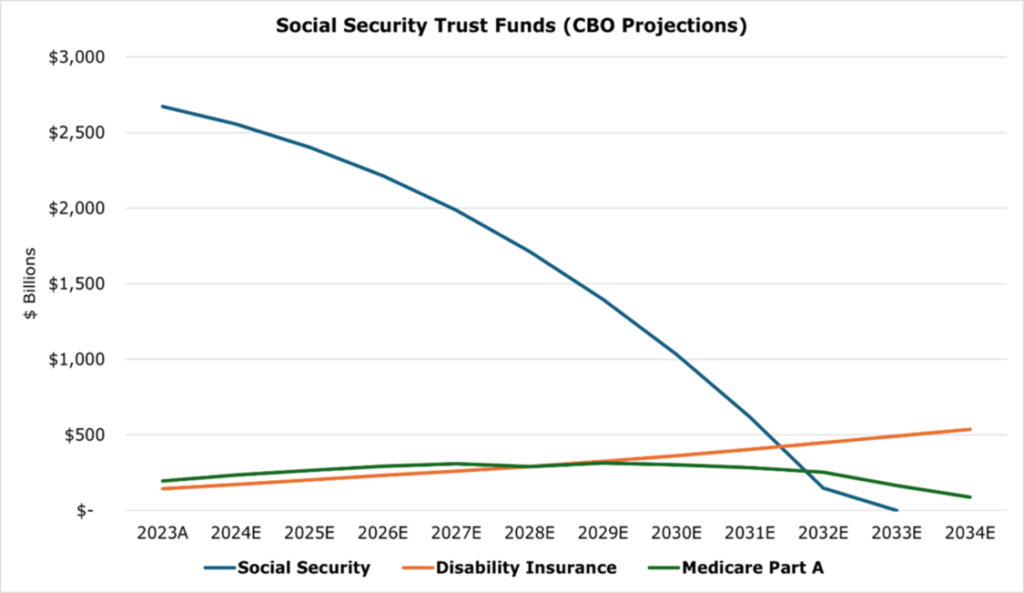
This will undoubtedly be exacerbated by social security and Medicare part A running out of funds by 2033 and 2035 respectively, with CBO projecting payroll taxes only covering 80% of benefits once the trust funds run out. This is however not politically feasible and will just result in an increase in deficit spending.