Economic and Market Review
February 29, 2024
| Equity Indices | YTD Return |
| Dow Jones | 3.40% |
| S&P500 | 7.45% |
| NASDAQ | 8.98% |
| MSCI – Europe | 1.31% |
| MSCI–Emerging | -0.60% |
| Bonds | |
| 2yr Treasury | 4.63% |
| 10yr Treasury | 4.24% |
| 10yr Municipal | 2.53% |
| U.S. Corporate | 4.87% |
| Commodities | |
| Gold | $2043.58/oz |
| Silver | $22.66/oz |
| Crude Oil (WTI) | $78.30/bbl |
| Natural Gas | $1.85/MMBtu |
| Currencies | |
| CAD/USD | $0.74 |
| GBP/USD | $1.26 |
| USD/JPY | ¥149.96 |
| EUR/USD | $1.08 |
Overview
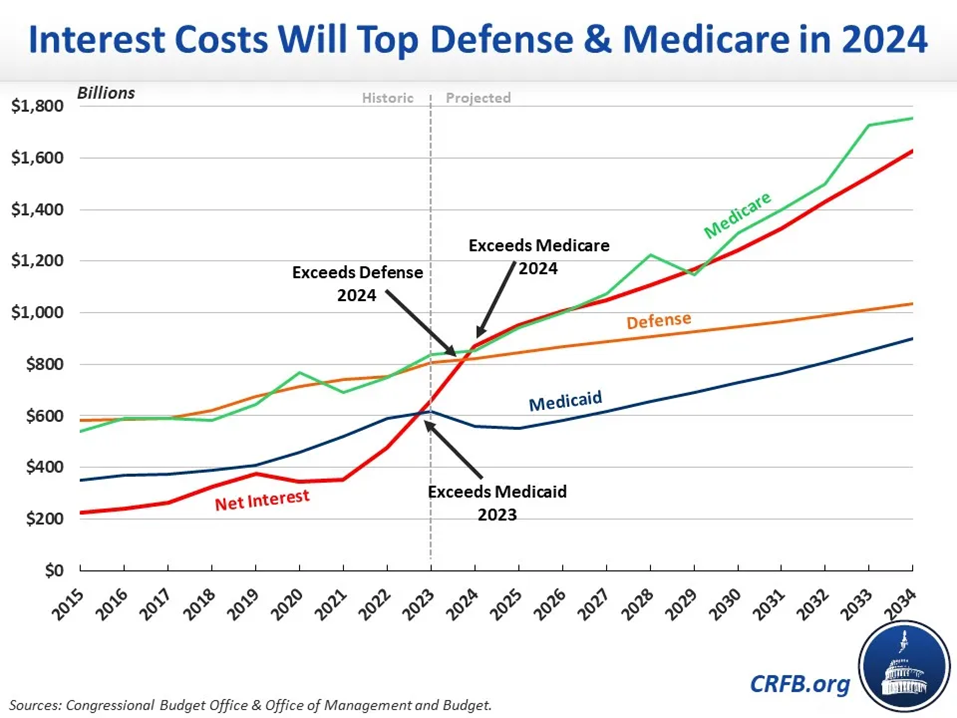
The Congressional Budget Office released its yearly budget estimates. It reports that interest expense on existing federal debt will surpass both defense spending and Medicare in 2024. The upward trend in interest expense has raised further concerns about the US Government’s ability to solve the impending debt crisis.
A sell-off in the government bond market has driven up yields as investors cut expectations for the number of rate cuts during 2024. While initially optimistic, stubborn inflation coming in at 3.1%, hot consumer demand, and rapidly inflating housing costs have significantly tempered expectations.
Despite moderation in interest cut expectations and higher-than-expected inflation, stocks continued to rally, albeit with less vigor than in January. The S&P500 remained unable to breach the 5,100 level in February.
US jobless claims continued to drop; however, estimates show that labor force participation is still lower than pre-pandemic levels. The lack of recovery in job-market participation could be a driving reason behind the labor shortage that has pushed up labor costs across industries.
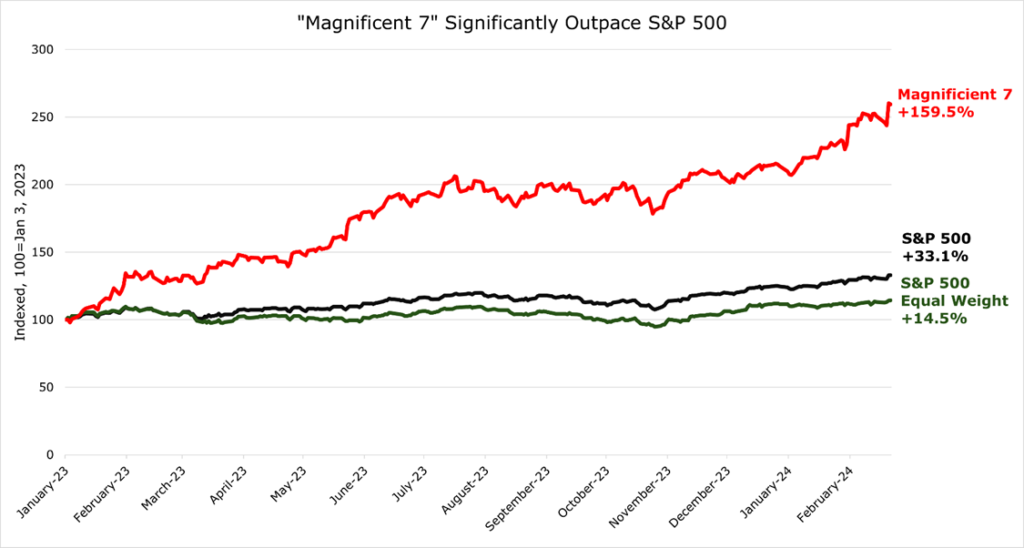
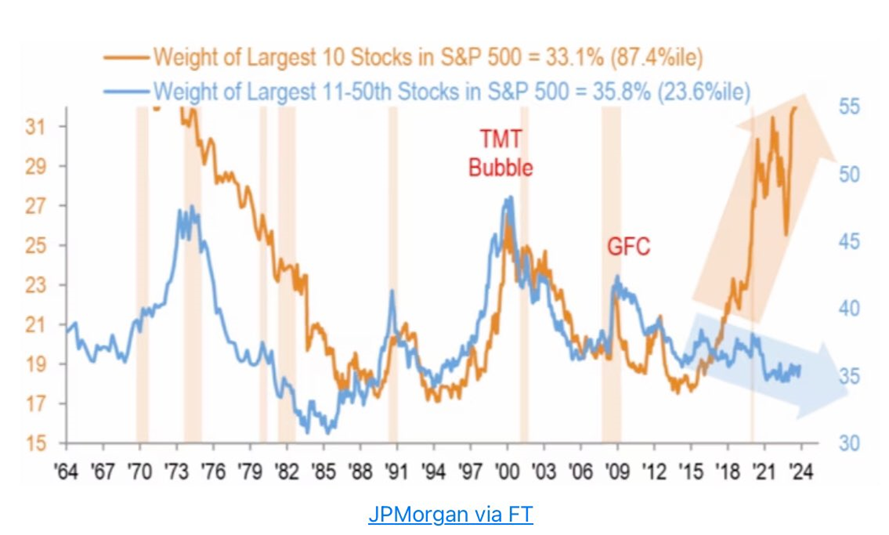
Magnificent 7 Continues to Dominate Returns
The “Magnificent 7” has become a calling card for the top 7 stocks in the S&P 500. The top 7, Alphabet, Amazon, Apple, Meta, Microsoft, Nvidia, and Tesla, have the same market capitalization as the next 42 companies combined and have dominated returns. In the equal-weight S&P 500, they only make up just under 2% of the total index’s composition. In the normal market-cap-weighted S&P 500, they make up 30% of the composition.
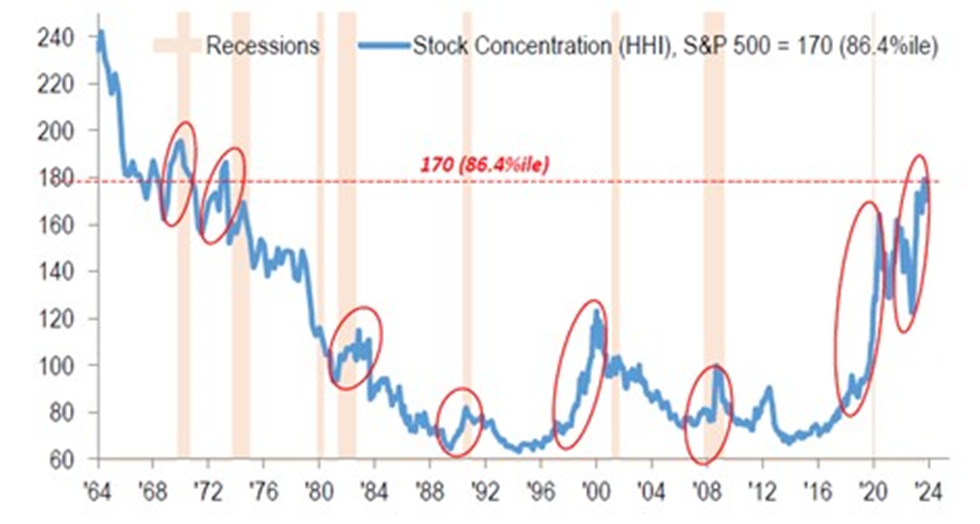
The HII (Herfindahl-Hirschman Index) is a common tool to determine the concentration risk of a portfolio. The higher the number, the higher the concentration, and the higher the risk. Market concentration has reached levels not seen since 50 years ago, with the technology sector holding more than 40% of the market cap in the S&P 500.
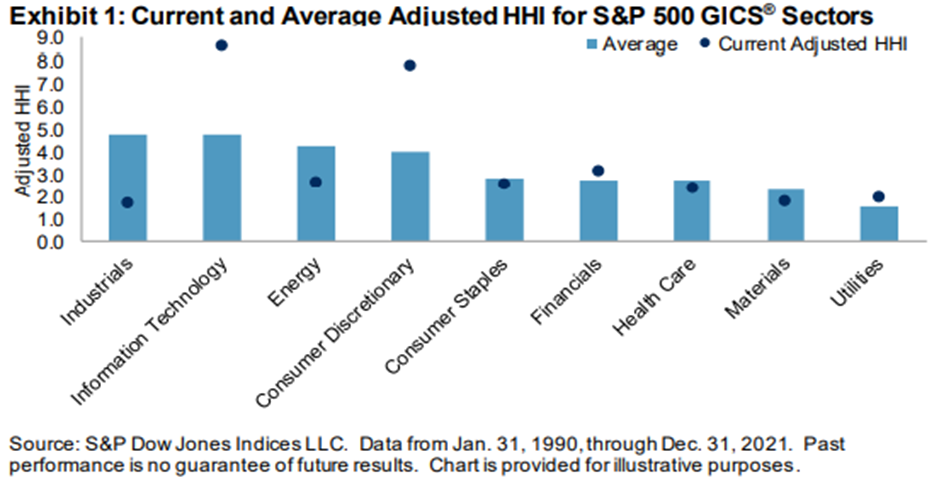
Many see this increasing concentration as a leading indicator of recession
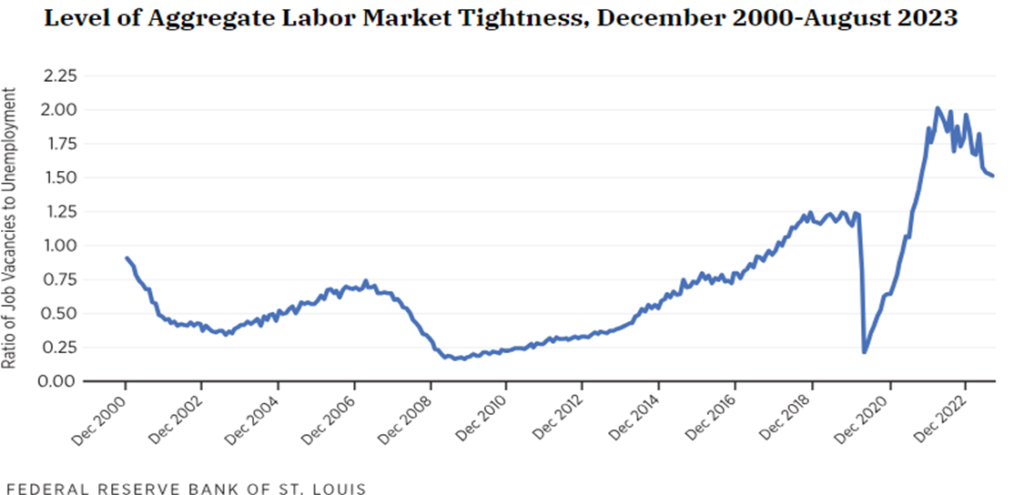
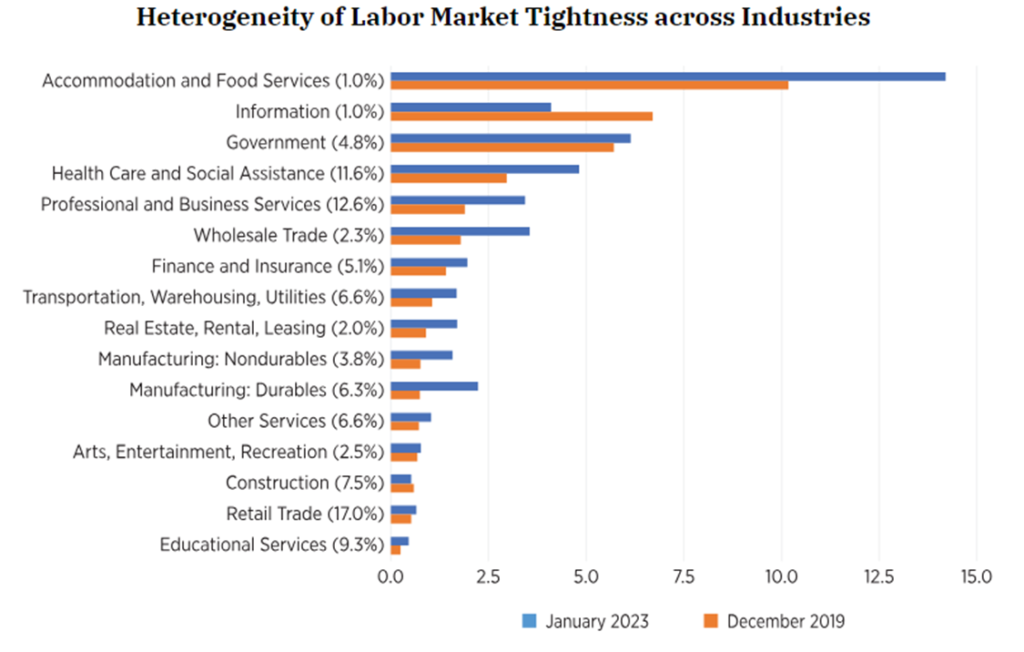
Labor Market Hot, Though Participation Remains Low
US jobless claims have fallen again, with 9.5 million job openings compared to just 6.5 million unemployed. US job growth has been one of the primary reasons the economy has narrowly avoided recession thus far. However, the sustainability of this trend is something that worries economists.
The labor force participation rate has fallen to lows not seen since the late 70s.
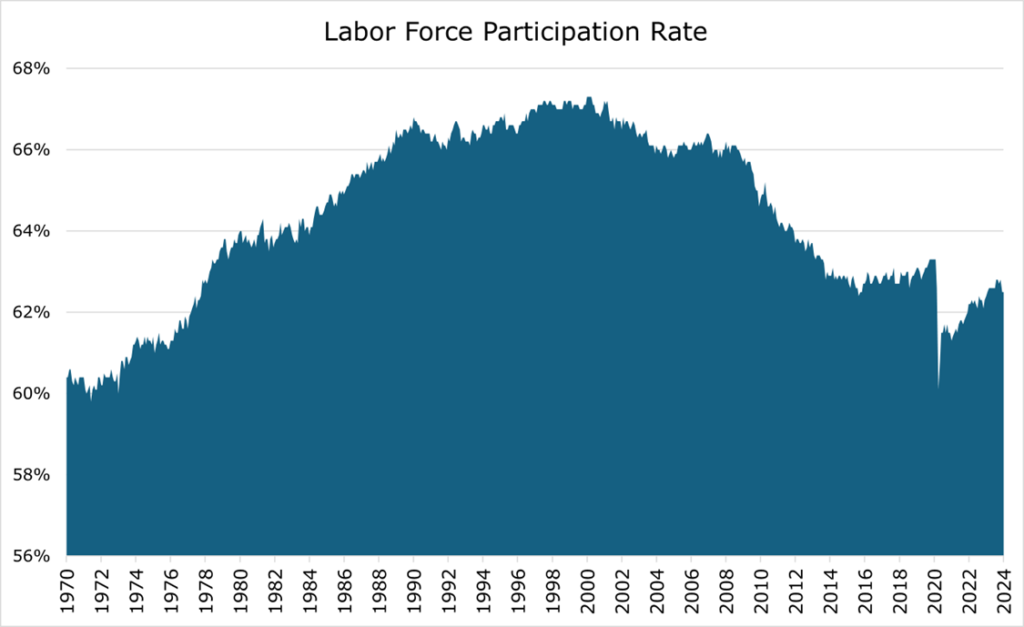
The US Chamber of Commerce conducted a survey that showed the reasons for low participation varied. Many have retired early (17%), become full-time homemakers (19%), transitioned to part-time work (14%), or went back to school (5%). More still are searching for better benefits, with 49% stating they will not take a job that does not offer remote work. In the areas most affected by participation rate, like the service industry, 33% state that wages are still not high enough for them to consider returning to service work.
Fed Remains Unsure of Interest Rate Regimen
During the first meeting of the year in late January, the Federal Reserve Board met to discuss the first potential interest rate cut. While they acknowledged that inflation is trending down, there are several complicating factors before they decide on a cut.
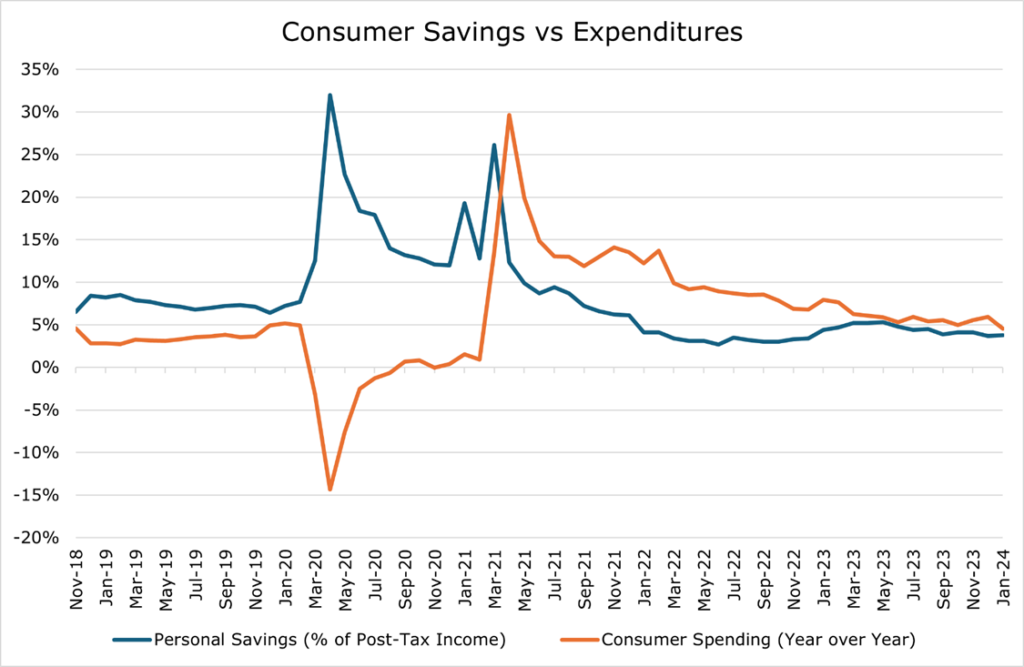
Strong consumer demand has been one of the driving factors behind inflation, and cutting too quickly could re-start demand-driven inflationary pressures. Consumer spending increased by 4.5% year over year in January. However, the savings rate of consumers stayed low at 3.8% of post-tax income. This may signal to the Fed that there is still more work to be done to return to normal. PCE inflation (personal consumption expenditures index) increased by 2.8% year over year in January, which is still far from the 2.0% PCE inflation the Fed targets.
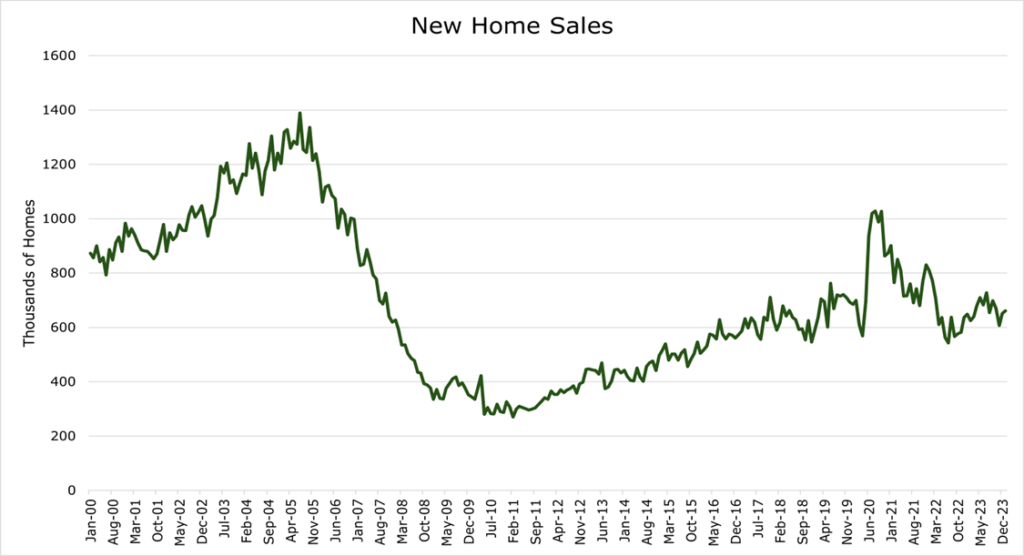
Housing costs have continued to increase above inflation despite rate increases, with the Fed previously taking a ‘wait and see’ approach. While the Fed was hoping that housing data was merely lagging the cooling of inflation seen elsewhere in the economy, this may not be the case. New home sales fell far short of expectations, only adding 661,000 new homes compared to the expected 680,000.
Additionally, private sector analysts have begun to raise housing inflation forecasts for 2024, with the Chicago Fed president stating that the exact dynamics at play in the housing market still elude economists.
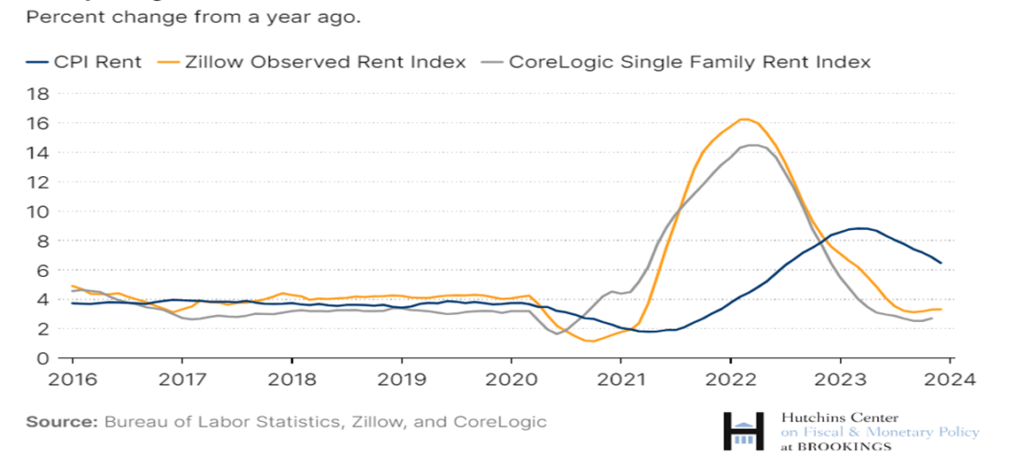
The reason for the significant lag to the rest of CPI and private-sector analysis is the way housing CPI is measured.
Normal CPI is calculated by comparing the price of a basket of goods today to a year ago. The BLS calculates housing inflation by surveying homeowners and renters to determine owners’ equivalent rent (the estimated rent homeowners would pay for their own homes) and the actual rent of primary residences by renters. These figures are then weighted based on their proportion in the housing market and combined to determine a final figure.
While this method removes short-term volatility from the calculation, it lags the market significantly as it is based on existing homeowners and existing renters rather than new leases or new home purchases. Therefore, this methodology can underestimate the total cost of new home ownership, like mortgage interest or taxes, and can undershoot the cost of new rentals.
These items, combined with higher-than-expected job growth and sticky inflation, have pushed back analyst expectations for the first initial rate cut from being expected in March to being expected in June. Equally, the magnitude of cuts is now in question, with initial estimates of 150bps cut by the end of the year moderating significantly to around 80bps.
Interest Payments will Exceed Defense and Medicare Spending in 2024
According to the CBO (Congressional Budget Office), interest will become the largest government expenditure during the year before being surpassed by Medicare as the population ages. Interest payments will exceed $1 trillion by 2026 and $1.6 trillion by 2034, according to the CBO. We estimate interest costs will be above these government-produced wishful guestimates. Nonetheless, the CBO numbers are astronomically high, representing more than 3.5% of total US GDP.
As we discussed in our article, as interest payments on Federal debt go up, the requirement to issue additional bonds to cover previous interest payments further increases the debt burden, necessitating even higher yields to attract investors. This essentially leaves only the Fed as a viable buyer of Federal debt at low-interest rates.
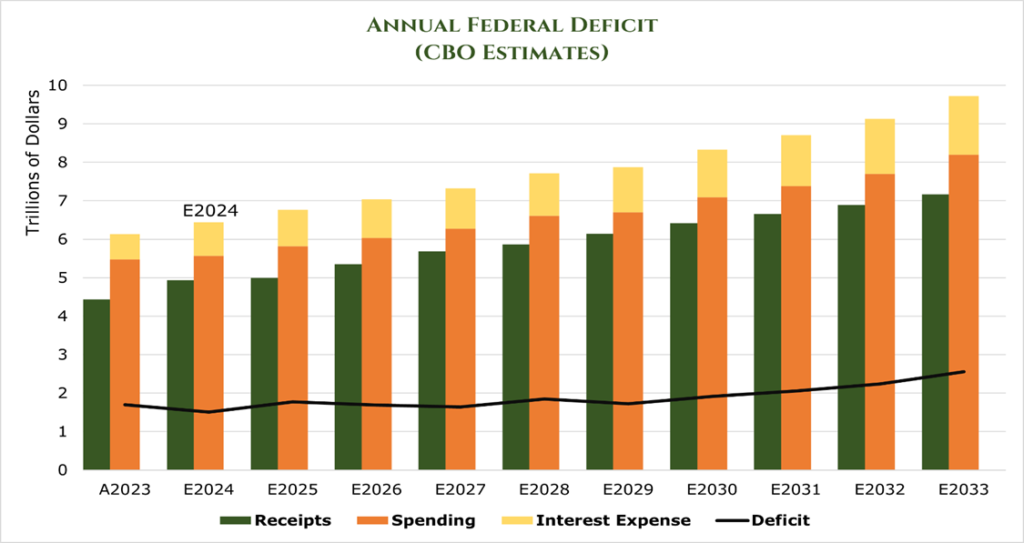
CBO’s new calculation expects slightly less deficit by the end of the decade due to the cutting of outlays by the Fiscal Responsibility Act and the Further Continuing Appropriations and Other Extensions Act of 2024. However, the interest expense is higher in the new estimate.
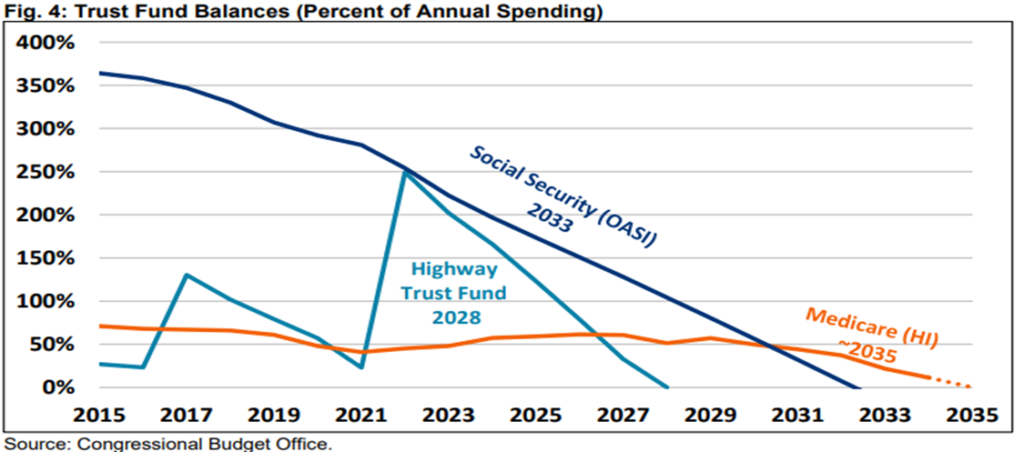
More grimly, as the average age of the US population begins to increase and more Baby Boomers receive Social Security than pay into it, there will likely be a secular increase in outlays without additional revenue to back it up. This will drain the trust fund that pays entitlement liabilities, and the CBO projects it to be dry by 2035.
As a percentage of GDP, federal outlays will exceed their 50-year average every year starting in 2024, with revenues falling below their 50-year average.
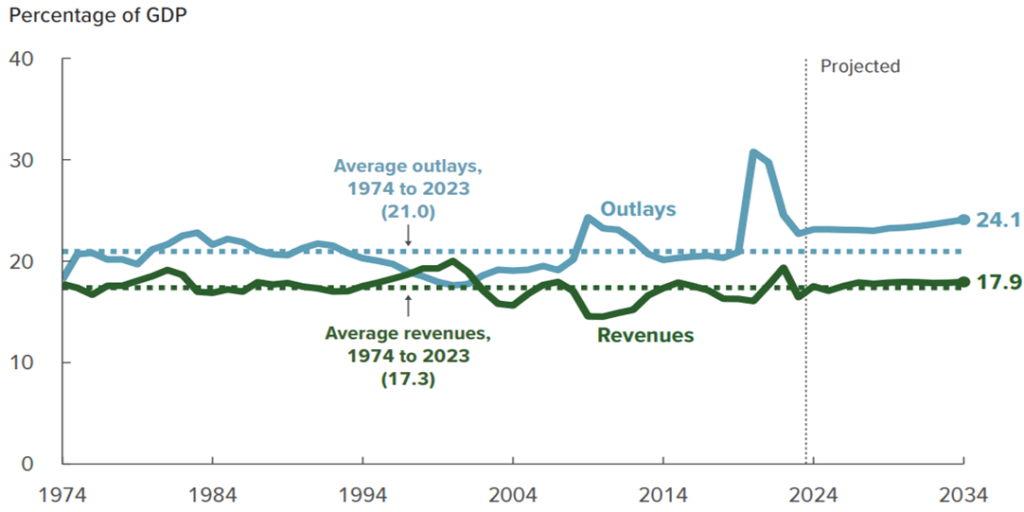
In our view, these numbers will be much higher as the decade progresses as the CBO projections do not include any recession or crisis requiring further government spending and instead price in an interest rate of ~3.5% for the rest of the decade.
Consumers are Buying Less for More, Eroding Confidence
According to a McKinsey report, consumers are shopping as frequently, if not more so, than a year ago but are often buying fewer items and spending more money.
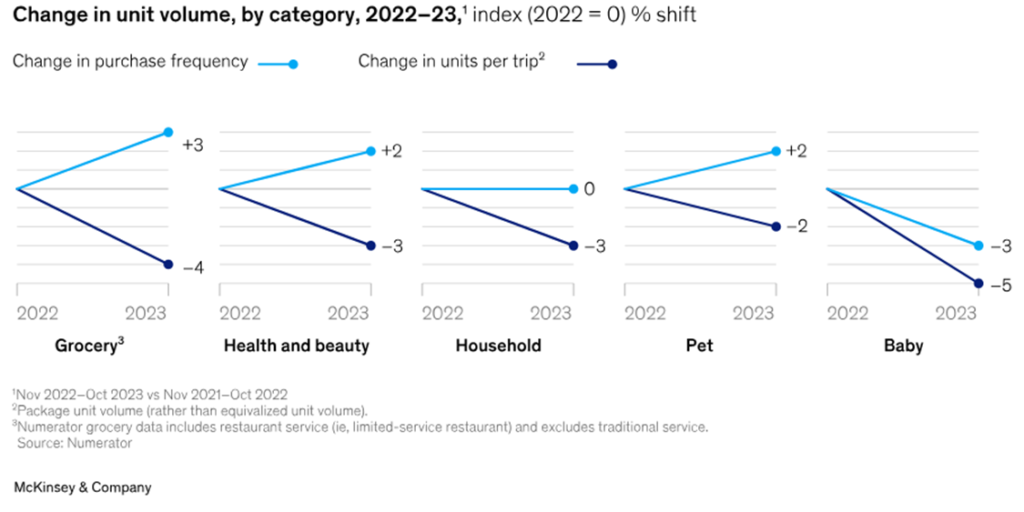
Of respondents, 78% report feeling the price increase at the grocery store, with 41% stating they can no longer afford as much food. The USDA estimates that consumers are paying almost 20% more for the same amount of food as they were in 2021.
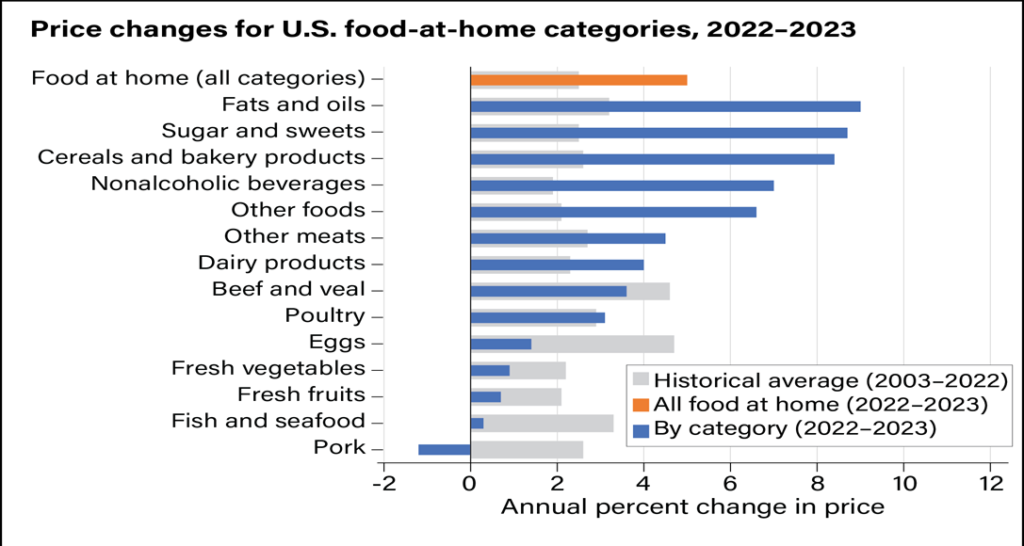
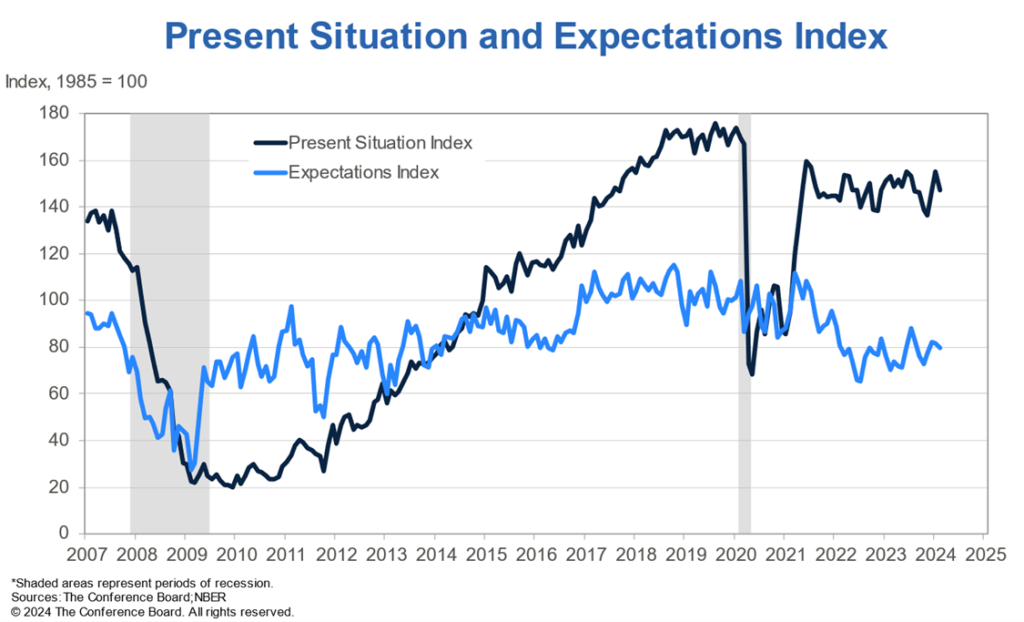
Food inflation has far exceeded the 20-year historical average over the 2022-2023 period. Of total disposable income, the USDA now estimates that Americans are spending 11.3% of their disposable income on food, the highest level reported in over 30 years. Despite an increase in January, the consumer confidence index was down again in February, with more consumers reporting uncertainty about the future than last month.
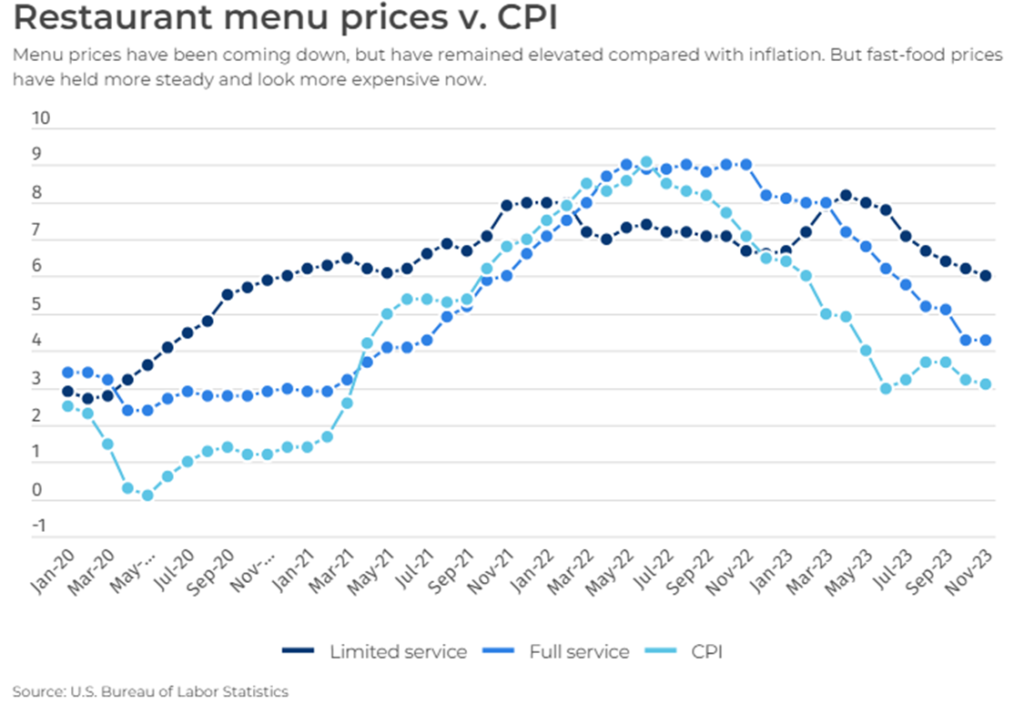
Economists say a mixture of inflation, labor costs, supply-chain cost increases, and even “shrinkflation” are behind the drop in consumer confidence and rise in cost for consumers. The effect of labor costs is more pronounced in restaurants, which have seen cumulative price increases of around 30% since 2021.
In conclusion, amidst the backdrop of persistent inflation, rising housing costs, and the mounting burden of federal debt interest expense, the economy continues to grow, fueled by robust consumer spending and low unemployment. However, the sustainability of this trend is uncertain, especially with labor force participation at historic lows and with growth showing signs of slowing down. Combined with the uncertainty introduced by the ongoing presidential election, the outlook of interest rates, stocks, and the broader economy remains unclear.