Economic and Market Review
April 30, 2024
| Equity Indices | YTD Return |
| Dow Jones | 0.50% |
| S&P500 | 5.81% |
| NASDAQ | 5.69% |
| MSCI – Europe | -1.90% |
| MSCI–Emerging | 0.50% |
| Bonds | |
| 2yr Treasury | 4.95% |
| 10yr Treasury | 4.62% |
| 10yr Municipal | 2.79% |
| U.S. Corporate | 5.68% |
| Commodities | |
| Gold | $2319.01/oz |
| Silver | $26.60/oz |
| Crude Oil (WTI) | $79.43/bbl |
| Natural Gas | $1.95/MMBtu |
| Currencies | |
| CAD/USD | $0.70 |
| GBP/USD | $1.25 |
| USD/JPY | ¥156.02 |
| EUR/USD | $1.07 |
Overview
The fight against inflation continues to be a significant economic challenge. Despite initial hopes that the Federal Reserve might begin cutting rates early, the market now only expects two rate cuts during the year. During the May 1 meeting, the Fed left the rate unchanged, currently targeting 5.25%-5.5%. The statement released was more pessimistic than previous releases, stating that existing data does not have enough forward progress to justify a cut. However, during the press conference, chair Jerome Powell stated that it is unlikely that they will choose to increase rates further. Moreover, the Fed has begun to slow the speed of QT (quantitative tightening).
Equities had a busy month, with a substantial portion of the S&P500 reporting earnings. Thus far, 80% of reporting companies have exceeded expected earnings by 10%, according to Edward Jones. However, hot inflation data and weaker-than-expected GDP posting saw the S&P500 end the month down 3.6%.
Fixed income was more positive, with Treasury yields moderating and corporate credit spreads tightening, indicating a reduction in systemic default risk. Internationally, the Bank of Japan abandoned its policy of yield-curve control, bringing rates out of negative territory for the first time in 17 years.
Overall, commodities (2.7%) and Emerging Markets (0.5%) were the only asset classes that saw positive month-over-month returns in April.
The Fight Against Inflation Is Far From Over
While initially, there was some hope the Fed may begin cutting rates early, data over the trailing 3 months has proven the fight against inflation is far from over.

After the May 1 meeting of the FOMC, the Fed used more pessimistic language than it had in previous months, stating that there has been a distinct lack of forward progress on reaching the 2% inflation target.
Persistently high housing prices are mainly due to increased housing demand fueled by a robust job market and a limited housing supply, at least partially fueled by current homeowners’ reluctance to move and forfeit low mortgage rates. For housing inflation to move downward, either an increase in housing supply, which is unlikely in the short term or a quick deceleration of labor costs would be needed.
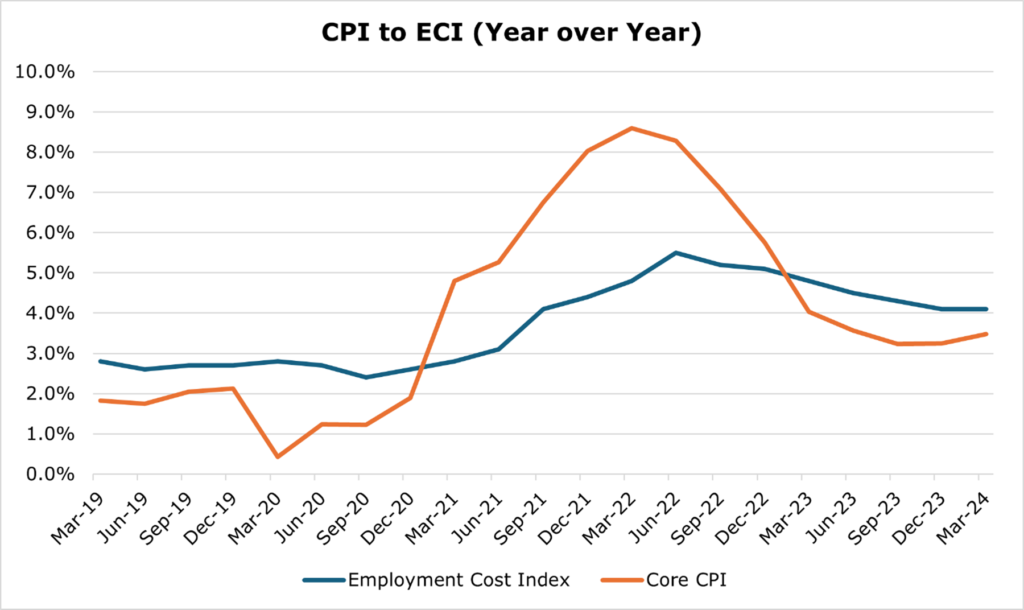
Inflation less energy, food, and housing, often referred to as “supercore,” is accepted as a proxy measure for labor costs across the economy. Over the trailing 3 months, super core inflation jumped to 5.5% on an annualized basis, rising at the fastest rate since December 2021.
Cracks Begin to Form in Strong Job Market
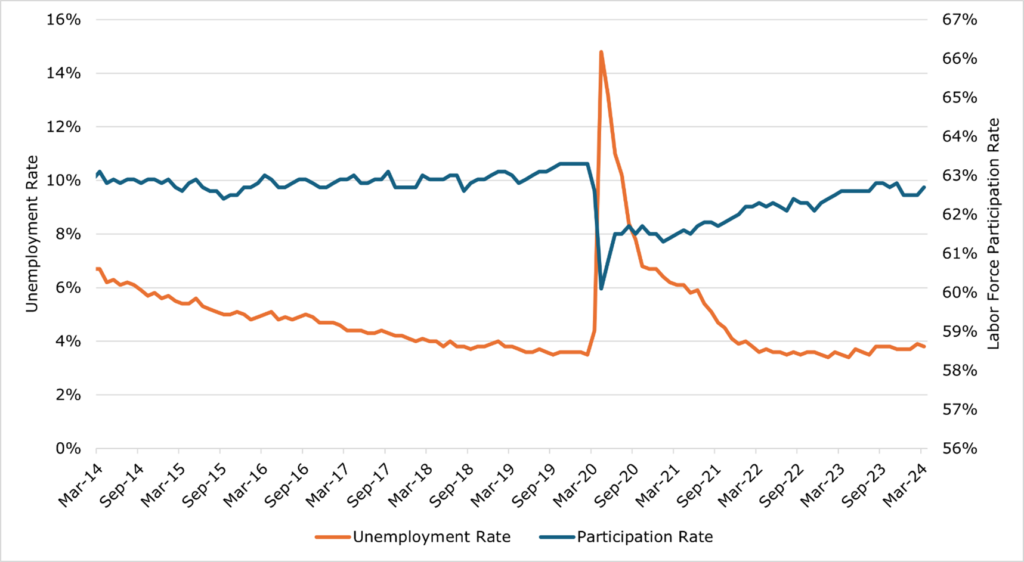
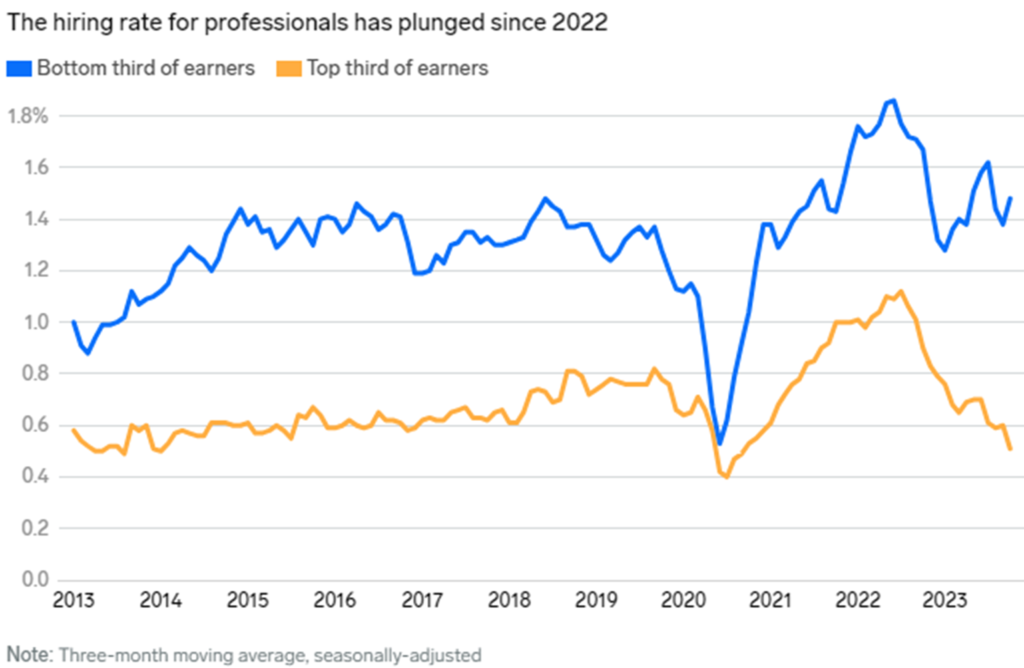
The unemployment rate has remained strong despite lower participation than expected, though some weakness is being demonstrated in higher-level white-collar hiring.
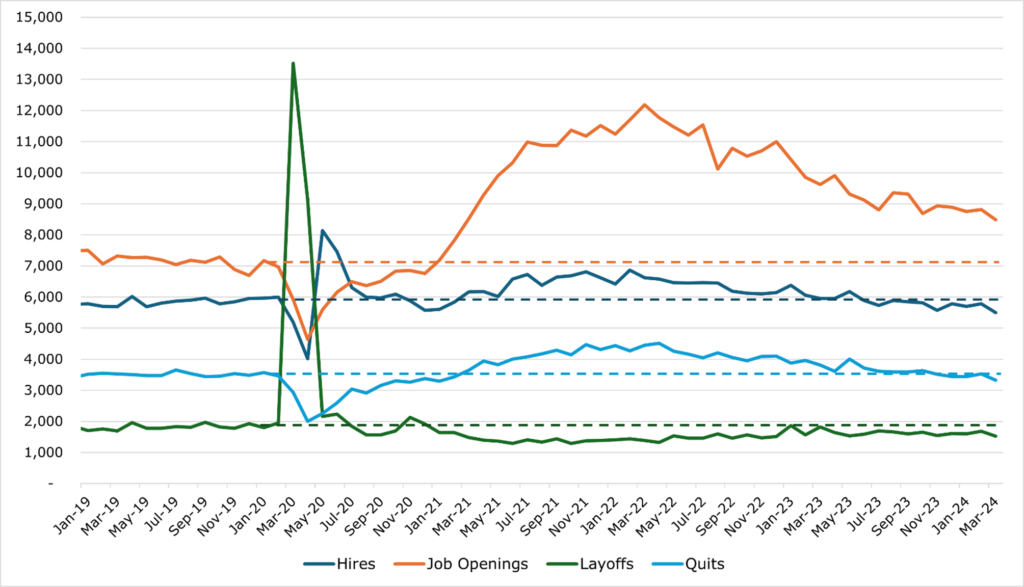
A key metric outside of the employment rate is the JOLTS (Job Openings and Labor Turnover Survey). The latest JOLTS release indicated falling levels of quitting and firing. However, it also showed a significant slowdown in hiring despite sustained job opening numbers.
The gulf between hire rates on the bottom third of earners and the top third of earners has widened significantly. Higher-income earners generally have higher levels of experience and are employed by more mature firms. A contraction in hiring of high-cost workers could be indicative of economic uncertainty or pessimism among firms.
While these items could indicate some slowdown in the labor market, the Employment Cost Index remained at 4.2%, a flat level since the quarter ending December 2023. The ECI is considered the most comprehensive measurement of total labor costs in the economy, as it accounts for wages, benefits, industry, and seasonal adjustments. With both CPI and ECI sticky and “supercore” accelerating, it all but confirms the Fed will need to continue to wait to drop rates.
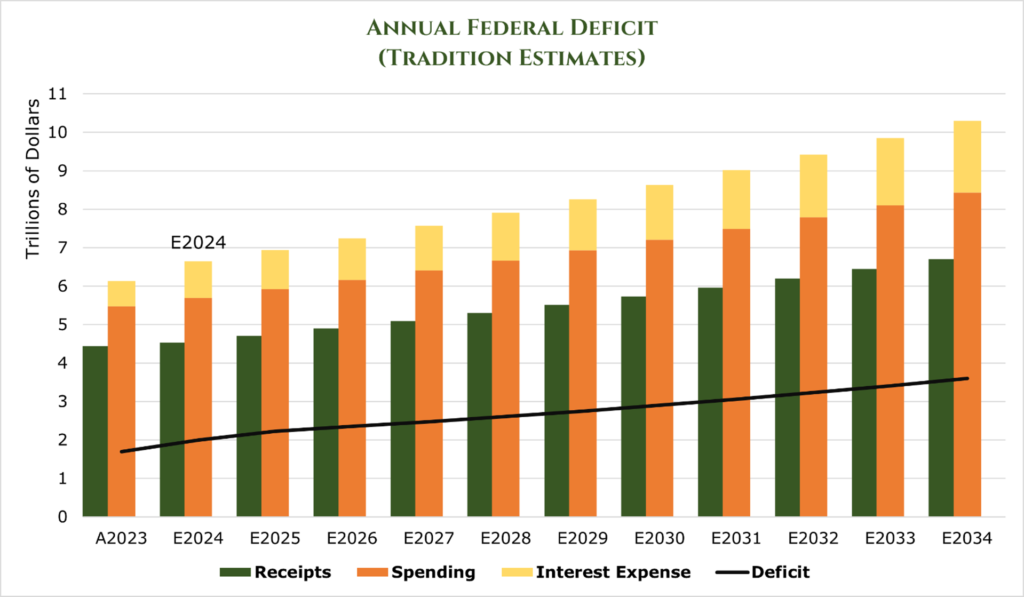
Treasury Begins Buyback Program Despite Concerning Deficit
The US Treasury Department has announced its intention to keep its auction sizes the same while also reintroducing repurchase programs.
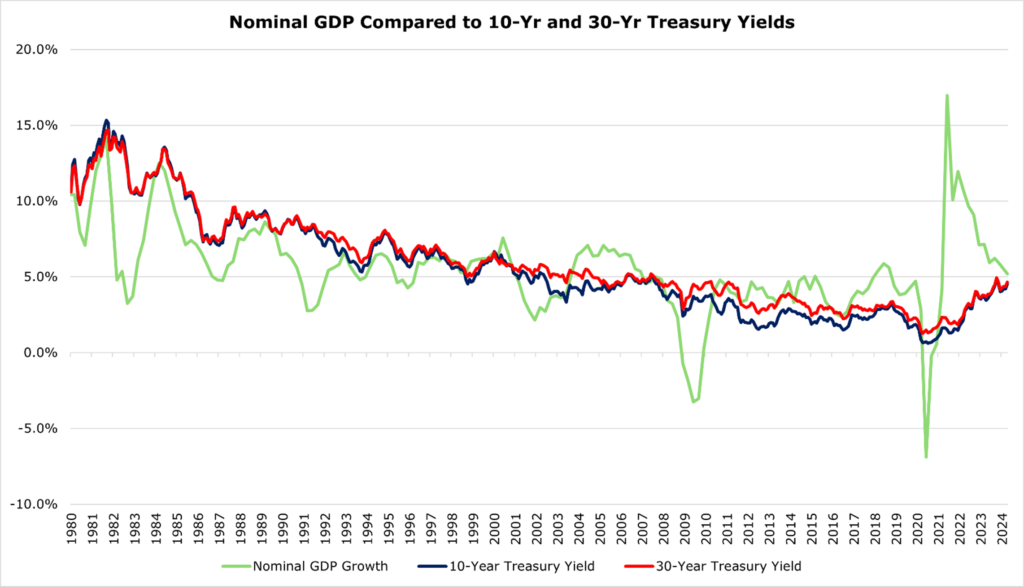
The Treasury Department issues debt ranging in maturity from 4 weeks up to 30 years. While the timing of these issuances varies, the most important are the quarterly auctions for the 3- 10- and 30-year bonds. As the US Deficit has skyrocketed, the Treasury Department was forced to increase the size of quarterly issuances drastically. This drove the price of the bonds down, skyrocketing their yields.
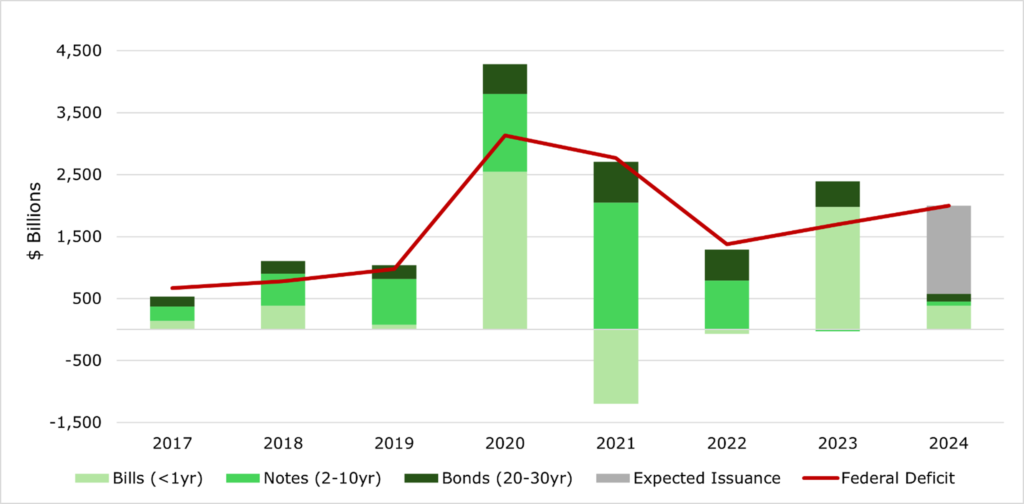
While the Treasury stated that higher-than-expected tax receipts and lower-than-expected spending had led it to believe that it would not have to increase the sale of bonds past current levels “for at least the next several quarters,” Secretary Janet Yellen did acknowledge that the fiscal spiral the US government is undergoing is concerning.
The Treasury has announced its plan for buybacks starting on May 29. These buybacks will be up to $2 billion in coupon securities across maturities and $500 million in TIPS (Treasury inflation-protected securities) weekly through at least July. The stated reason for this buyback program is to improve liquidity in the secondary market, with off-run Treasuries generally having less liquidity than their currently issued counterparts.
In our view, this is likely a measure to lower borrowing costs, as enhanced liquidity in the market generally lowers the yield on securities, which would reduce the government’s cost of debt, especially on the short end of the curve.
Is The Fed Blinking?
While the Fed maintained its rates at the current level of 5.25%-5.5% during the May 1 meeting, it did state that it would be cutting its pace on QT down to $25 billion per month for Treasuries compared to its previous $60 billion level. Other forms of debt will remain the same at $35 billion.

The previous tightening schedule would’ve seen the Fed balance sheet return to pre-2008 crisis levels in January of 2030 at the earliest. The newest schedule extends this timeline to around June of 2033. However, these projections do not take into account any further instability in the market or the re-introduction of QE.
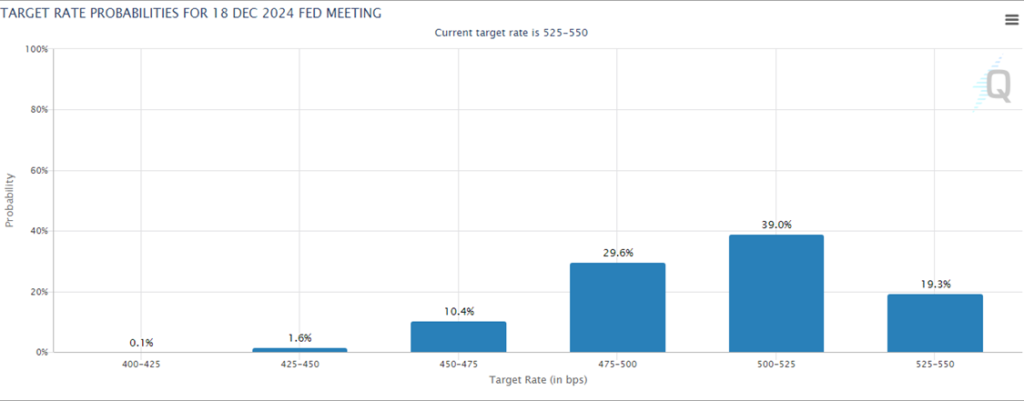
Initially, the Fed telegraphed that it would begin the QT ramp-down in the latter half of 2024. The early deployment of easing could indicate that the Fed is beginning to inch policy toward the loosening side of things. Even still, the vast majority of the market prices in 2 cuts for the full 2024 year, ending with less than 100bps decrease in the Federal Funds Rate.
Business Activity Moderates, GDP Decelerates
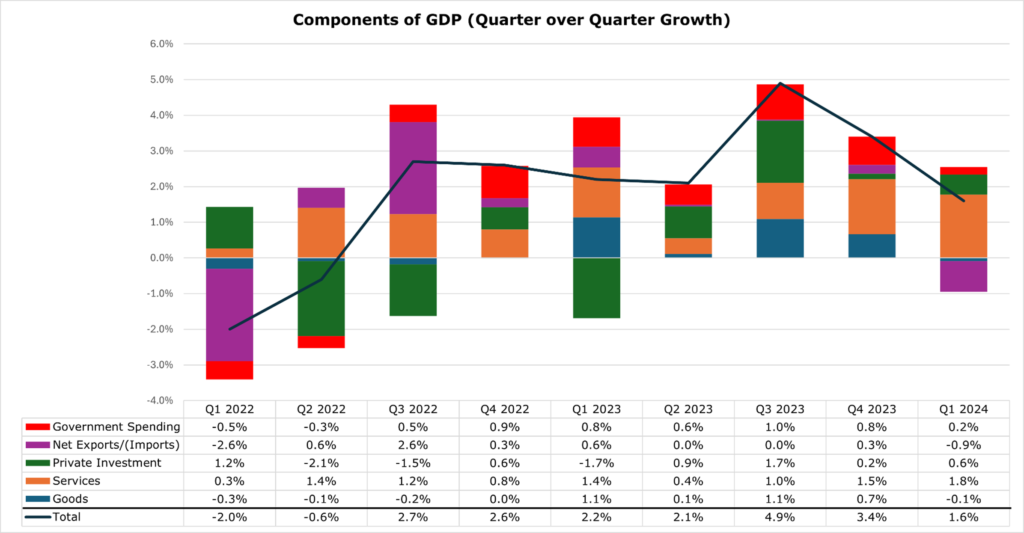
GDP growth came in at the slowest pace in two years, growing at a real rate of 3.1% annualized, or 1.6% quarter over quarter. US PMI (Purchasing Managers Index) data has cooled substantially, potentially indicating a slowdown in domestic business activity. Overall, the manufacturing sector has shifted toward a contraction, while services activity has begun to slow but is still buoyed by strong consumer spending and imports.
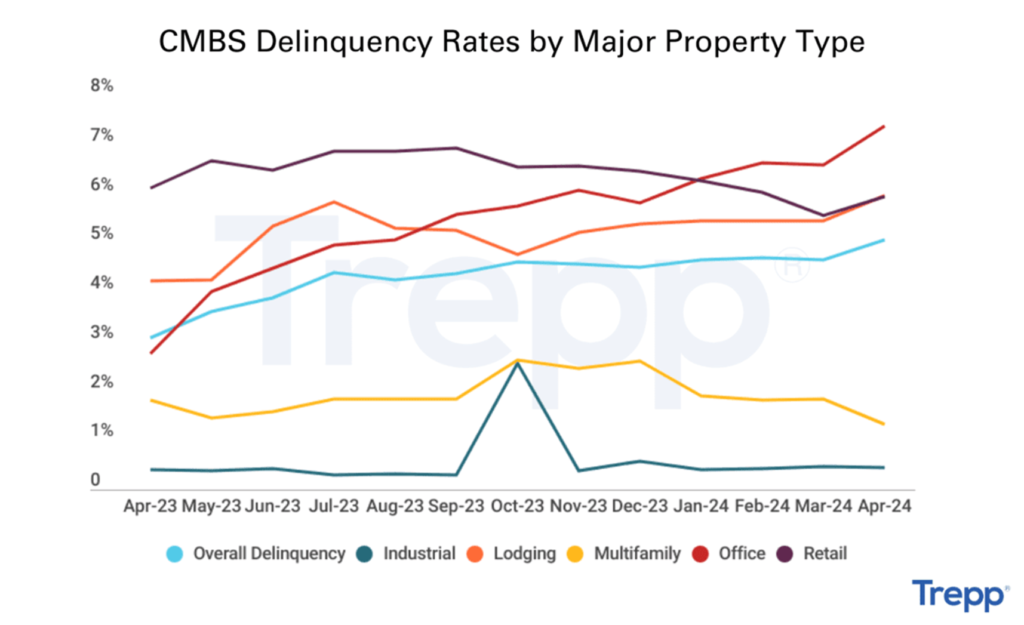
CMBS Delinquency Rates (Commercial Mortgage Backed Securities), a bellwether for fixed business costs, have begun to creep upward. Trepp sees particular weakness in office, retail, and lodging, which could indicate weaker services growth in second quarter GDP.
US Natural Gas Exports to Increase, Domestic Consumption Likely to Fall
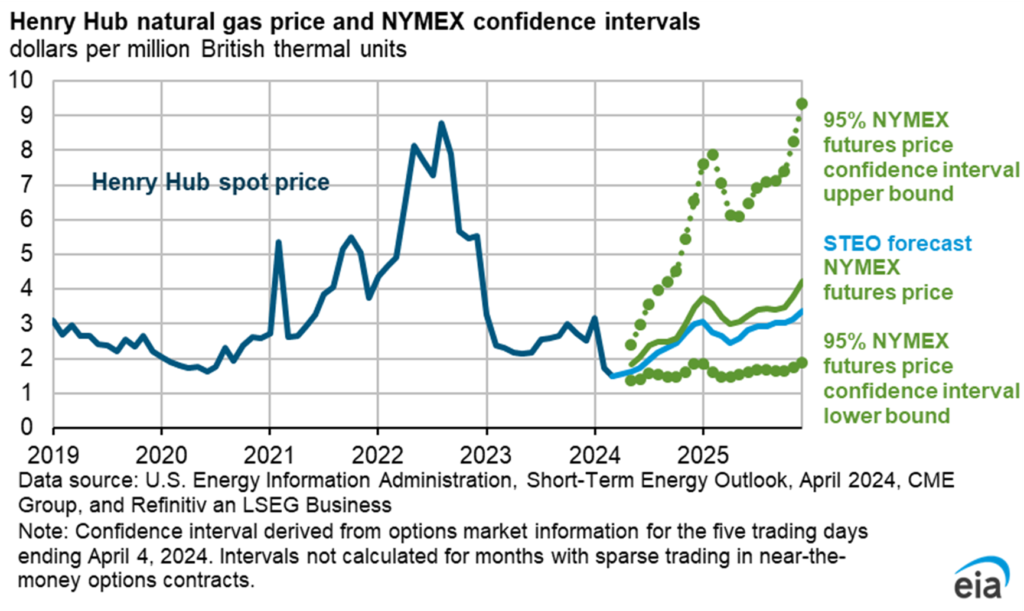
A milder-than-expected winter has led to the over-storage of natural gas across the US. According to the EIA, natural gas storage at the end of the withdrawal season (November-April) was 39% over the 5-year moving average. As a result, 2024 natural gas production will likely remain muted, with natural gas prices projected to remain in the $2.00-2.20/MMBtu range.
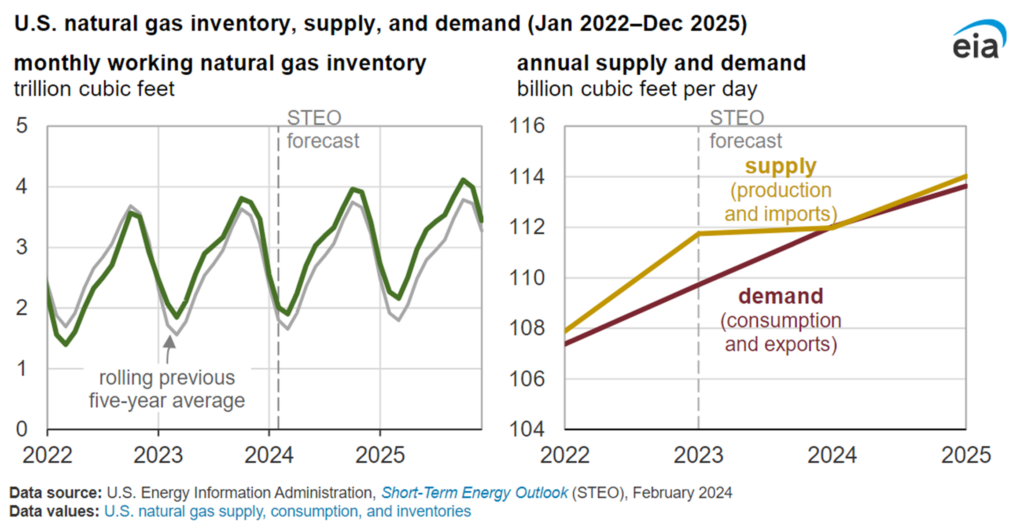
Over the short term, natural gas power plants generate about 40% of US electricity annually. Demand for heating and air-conditioning will strongly influence how much natural gas demand there is. The EIA expects around 11% more domestic natural gas consumption in 2024.
However, US exports will likely lead to natural gas growth over the medium term. Three additional LNG export terminals are currently under construction and will be ready for service by the end of 2025, adding nearly 50% capacity to the existing 11.4 Bcf/d in capacity. Aggregate exports of US natural gas are expected to grow by 26% by 2025, around the time when supply and demand will converge in the US, providing a longer-term tailwind that will allow for a substantial price recovery in the latter part of 2025.
