Aging Demographics and Medicare Advantage Growth Heal Outlook for Healthcare Sector
| September 25, 2023 |
- On a secular basis, a demographic shift toward an older population has tailwinds in care needs and individual spending per visit. Medicare Advantage (Medicare Part C) will grow to become the largest payor by 2026.
- Healthcare is recession-resistant, with the largest payors, Medicare and Medicaid, being price agnostic toward care.
- A concentrated effort in the sector to expand margins through rate increases, cutting administrative costs, and reducing contract labor.
- US spending on healthcare will grow at a 7.1% 5-year CAGR – outpacing GDP by an estimated 240bps.
Investment Thesis
The healthcare sector is in the midst of a post-pandemic recovery. COVID increased costs with extra precautions and nursing shortages, and it reduced some profitable procedures as patients avoided hospitals. On a secular basis, an aging population is driving demand. In the United States, this demographic shift is driving growth in the Medicare Advantage (Part C) market, which is estimated to grow to be the largest revenue source for healthcare providers. Healthcare is recession-resistant, especially now that Medicare is the largest single payor.
Aging Population
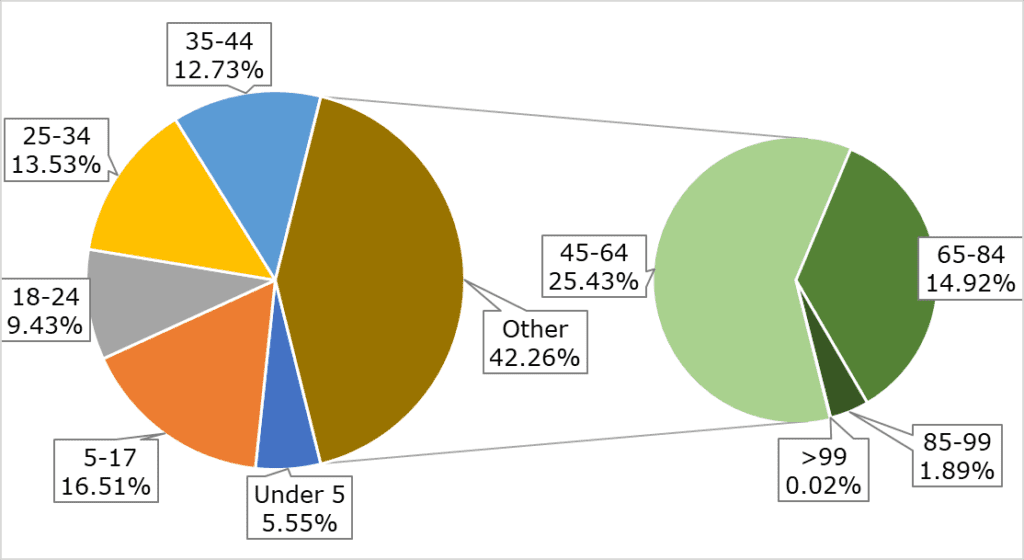
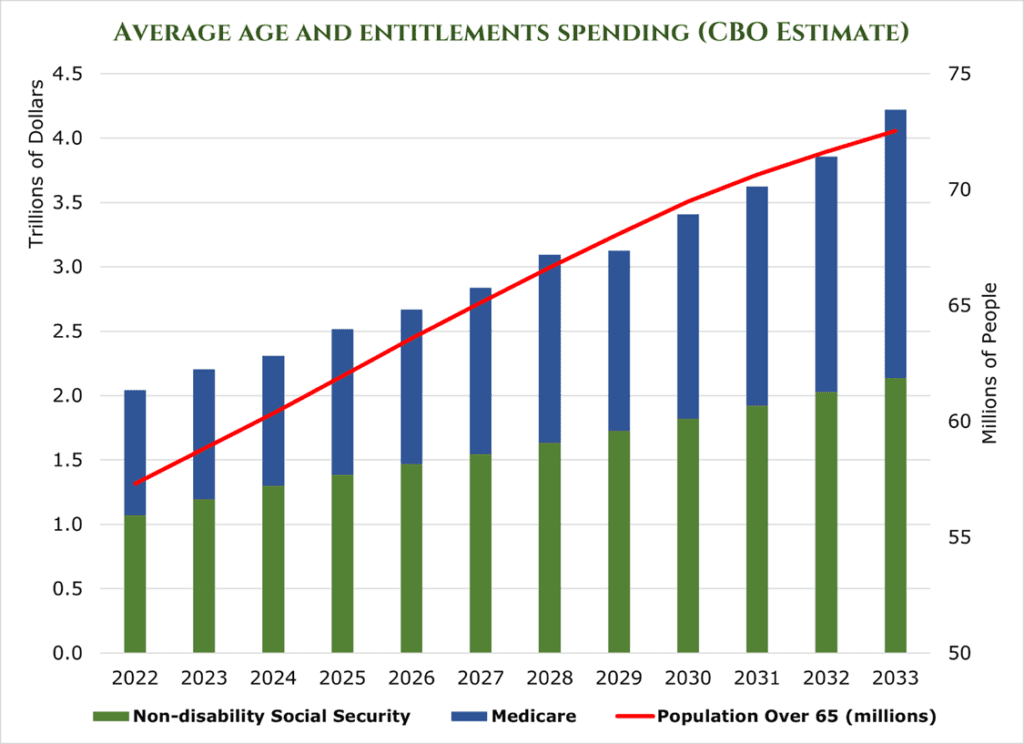
The US population is aging rapidly. The United States life expectancy has risen steadily since the 1960s, reaching a record 79 years old in 2019. By 2040, this number is expected to climb to 85 years old. The number of Americans 65 and older will double within the next 40 years, reaching an estimated 80 million in retirement age by 2040. A sharp increase in life expectancy, with the largest share of the population aging out of paying into Social Security and Medicare, will put immense fiscal pressure on government and private healthcare spending.
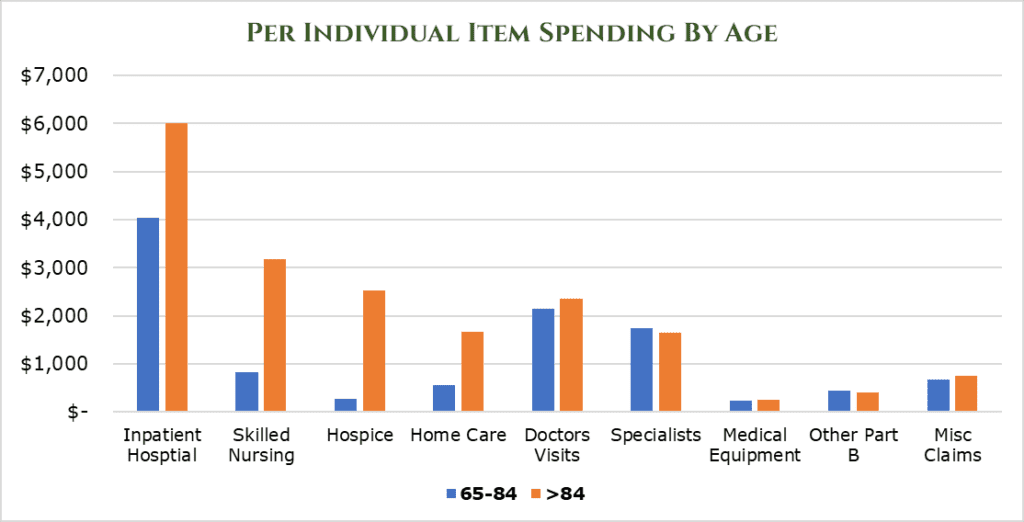
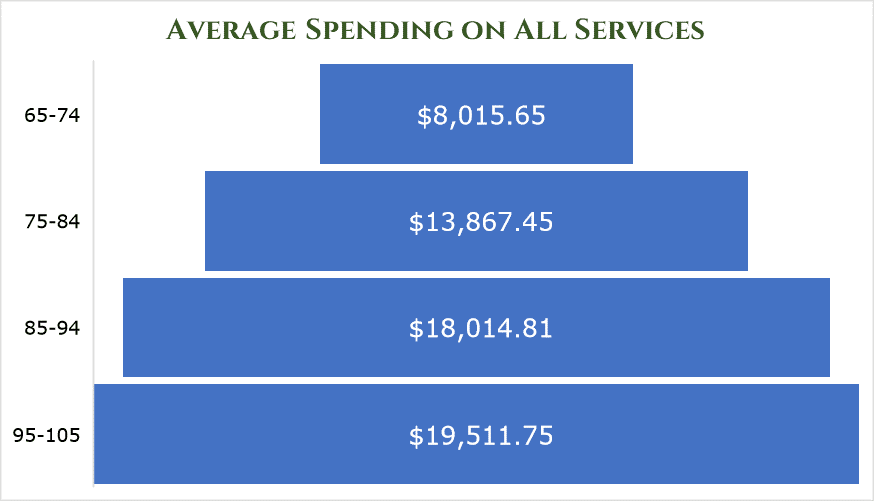
As age ramps up, the per-individual spending on items increases drastically, particularly in acute-care areas. By age 85, the average spend on healthcare is $18,014.81 per year per person.
The CBO estimates that by the end of the decade, non-disability social security and Medicare spending will grow to $3.5 trillion per year, a $1.5 trillion increase.
US Spending on healthcare has traditionally matched GDP, as hikes in prices above GDP generally bring the ire of the government and insurance payors. However, persistently high inflation, clinical staff shortages, and massive demand from an aging population have put upward pressure on healthcare prices. McKinsey estimates that US spending on healthcare will grow at a 7.1% 5-year CAGR – outpacing GDP by an estimated 240bps.
Medicare Advantage (Part C)
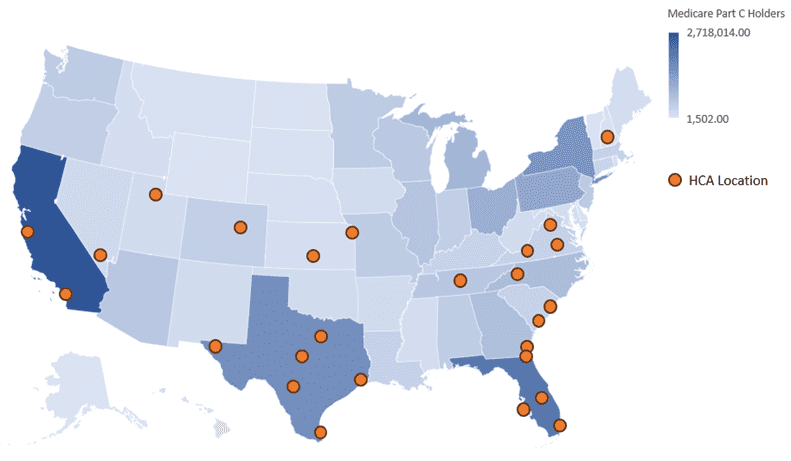
Medicare Advantage (also called Part C or Managed Medicare) plans provide both the government part of Medicare (Parts A and B) and additional benefits to the payee. Payers pay premiums like a normal insurance plan, but usually pay a heavily discounted rate as the government covers what Parts A and B would normally. What separates Medicare Advantage from the remaining Medicare programs is it works more like a traditional insurance plan. Medicare recipients tend to be service-location agnostic – all medical facilities are required to accept Medicare. However, Medicare Advantage plans operate within affiliate HMO Networks to provide benefits (Health Maintenance Organization), much like a traditional insurance plan. This means that Medicare Advantage plan holders must stay in-network.
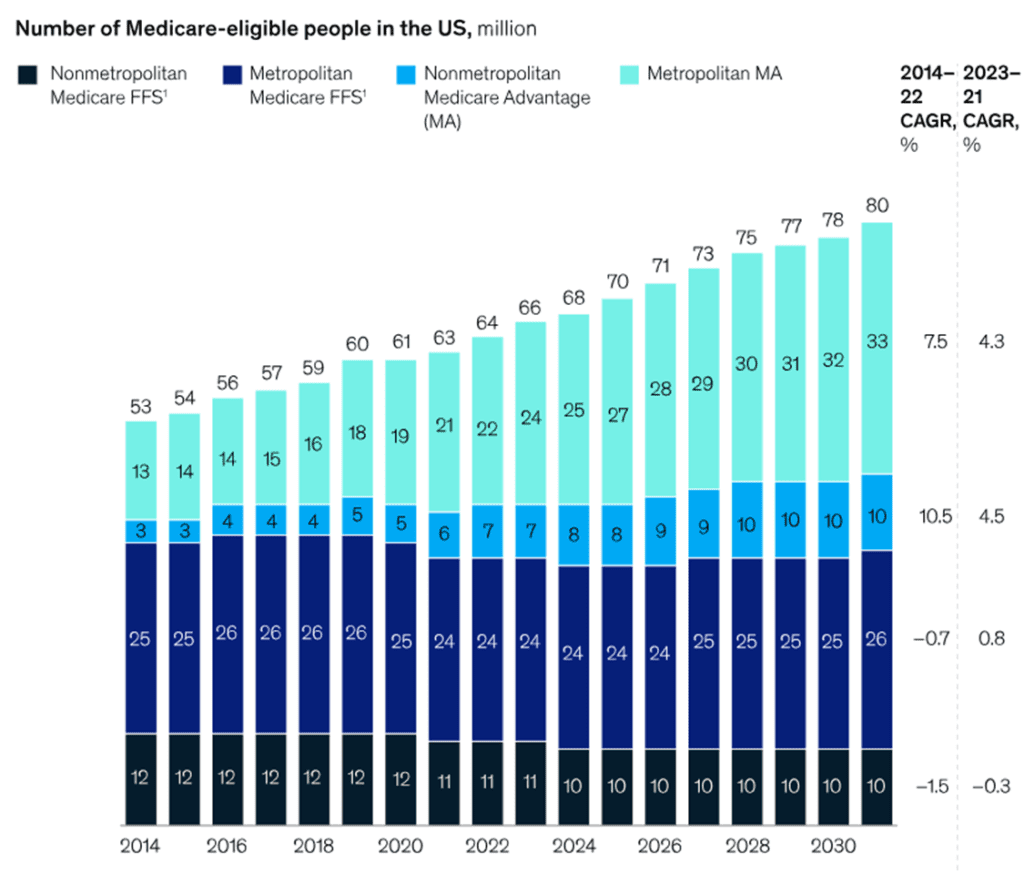
Medicare Advantage is projected to grow to be the largest source of revenue for healthcare providers by 2026. It is estimated that membership is growing at about 8% year-over-year, and it will reach around 52% penetration of Medicare recipients by 2026. This large sequential year-over-year increase will increase the addressable market significantly, with government estimates putting the Medicare Advantage total addressable market at $75 billion by 2026. Short-term pressures come from postponed elective or low-priority surgeries that were not conducted during COVID 2020-22.
Challenges
Inflation, coupled with COVID-19, had an intensely negative impact on the balance sheets of healthcare firms. Due to the cyclical and long-term nature of insurance and government contracts, healthcare firms are hard-pressed to pass down increased costs, which has eaten at the industry’s margins. McKinsey estimates that inflation and COVID-19-related expenses have reduced the EBITDA margins of the healthcare industry by 600bps. However, there is some relief in sight. Based on rate increase filings, insurance companies are seeking a median of 10% rate increases. Healthcare companies are beginning to pass on this cost to insurers.
An estimated shortage of 200,000 nurses and 50,000 doctors by 2025 will increase costs and limit the availability of services. As a result of short-sighted policies, there is not much relief on this front. Historically, Physicians Associations and Nurses’ Associations have strongly opposed increasing the number of Doctors and Nurses allowed to enter the workforce. The problem is self-compounding, as doctors and nurses burn out in record numbers as their patient counts continue to increase. Hospital systems are turning to traveling nurses and other specialized temporary clinical staff to fill these gaps. In Massachusetts alone, temporary clinical staff expenses have grown 150% since before COVID-19. In 2023 is estimated that $248 billion in additional cost will be realized due to inflation in labor costs alone.
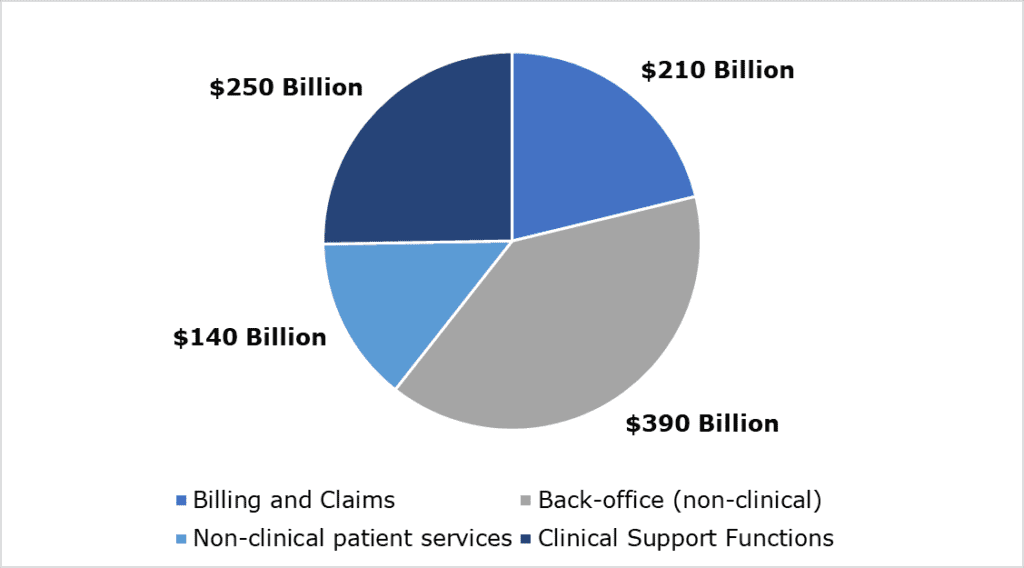
An endemic problem within the healthcare system is ‘administrative creep.’ Almost 25% of all costs are incurred in administration – or about $1 trillion annually. These costs vary, with non-clinical support functions eating up the lion’s share of administrative spending. It is estimated that between $285-570 billion of this administrative figure is unneeded.
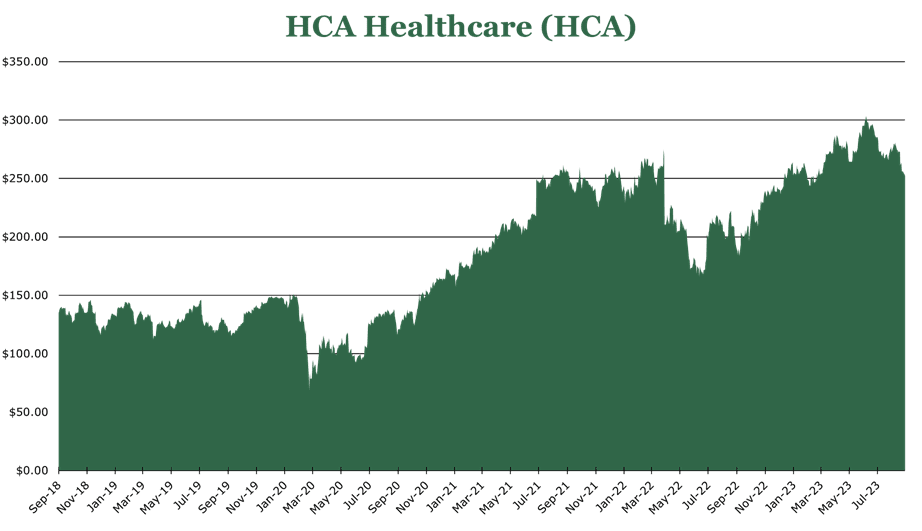
HCA Healthcare (HCA) – Medicare Advantage Growth and Cost Recovery
The HCA Network targets comprehensive coverage of the healthcare spectrum in localized areas. Across 182 hospitals and 2,300 care sites, HCA has 37.2 million patient encounters per year. HCA is the largest private hospital network in the world, with a 27.2% domestic market share by enterprise value.
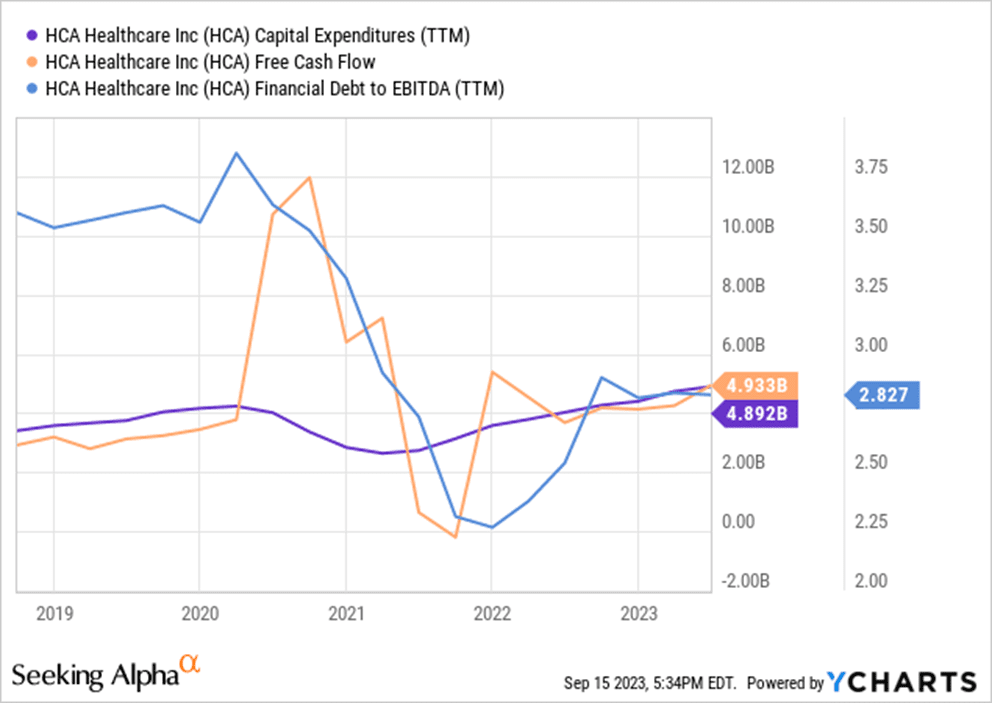
With the worst of COVID-19 over, heavier capital deployment is again back on the table. Of the $4.6 billion in capital investments for 2023, $4.4 will go toward internal growth. Short-term growth has 1,563 clinical beds in the 2023-24 pipeline and 664 ER beds. Additionally, HCA acquired a controlling share (90%) of its JV with Envision. HCA utilizes the JV company, Valesco, as a contract-labor finder. HCA estimates this will add $1 billion in revenue but will likely not contribute meaningfully to EBITDA.
HCA Pays out a small dividend with a 0.97% Yield. HCA engages in a significant share buy-back program, repurchasing $915 million in 2Q23. This is part of a larger share repurchase program amounting to $11 billion.
HCA Stands to benefit significantly from the localized nature of Medicare Advantage. For example, in the Dallas-Fort Worth area, HCA has 4,100 medical staff across 239 care locations covering the entire healthcare spectrum. This allows for significant geographic capture of private insurance providers and Medicare Advantage.
Revenue increased 7% year over year in 2Q23, attributed to a 3% increase in revenue per visit, and a 4% increase in admissions. Pent-up demand from procedure postponements during the height of the pandemic are beginning to be realized. Additionally, turnover on in-house nurses has decreased to 17%, with hiring increasing by 9% year over year. HCA turnover is below average, which sat at 22.5% in 2022. This decrease in turnover and increasing hiring has helped HCA reduce its contract labor cost by 20% yearly.
| HCA 1H23 Results | ||
| Ratio (As a percentage of total revenue) | Year over Year Change in Revenue Compared to 1H22 | |
| Medicare | 16.9% | 1.6% |
| Medicare Advantage | 16.2% | 11.3% |
| Medicaid | 4.7% | 24.1% |
| Managed Medicaid | 5.7% | -12.5% |
| Private Insurer | 49.2% | 8.1% |
| Other | 7.3% | -4.2% |
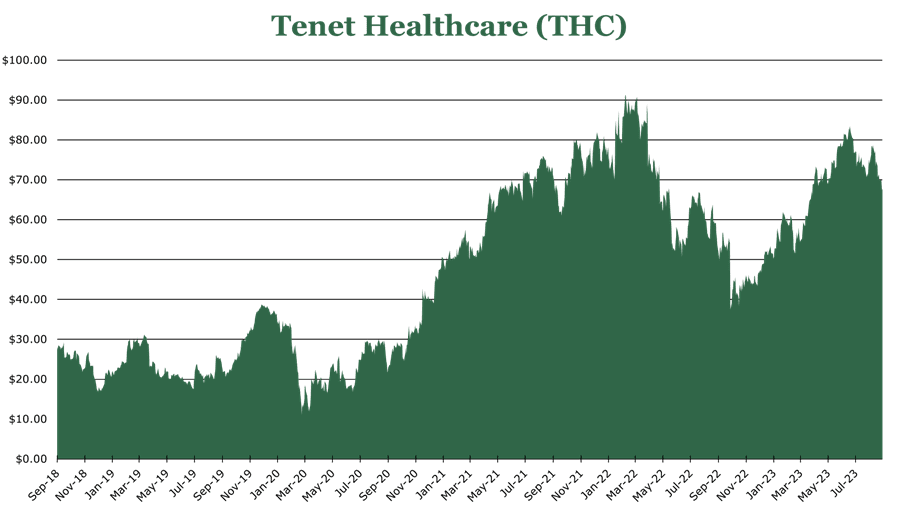
Tenet Healthcare (THC) – Free Cash Flow Healed by Core Competency Expansion
THC is a geographically diversified healthcare service provider focusing on specialist and surgical care. THC had 8.2 million patient encounters in 2022 across 527 hospitals and 109 outpatient care sites. THC is split into three segments: Ambulatory Care, Hospital Operations, and Confier segment.
Conifer provides value-added care services, such as IT consulting, to 670 non-THC clients. THC owns a 76% controlling interest in Confier. Confier has struggled to recoup inflationary costs, with EBITDA shrinking by 8%. However, there are significant tailwinds for Confier in the future, with a large portion of its business being outsourced admin services. The largest growth driver for Confier has been outsourced Medicaid eligibility determination services.
THC operates its ambulatory care network through its fully owned subsidiary USPI. USPI is the largest ambulatory care network in the United States, offering outpatient specialist services and outpatient surgical procedures. USPI was the largest grower which saw a 16.4% EBITDA growth year over year. EBITDA margins stayed constant at 40%. Largely, this has been attributed to pent-up demand from elective procedures that could not be conducted because of COVID-19. Total patient volume was up 6.6%, with per-case revenue up 2.9%. To continue this growth path, THC will allocate $250 million per year to growth in the USPI area, adding 12 new facilities in 2Q23.
In the Hospital segment, THC’s financial profile has improved despite COVID-19 and inflationary pressures. Revenue increased 7.6% year over year in 2Q23, with non-COVID admissions increasing by 5%. Additionally, contract labor has decreased in usage in THC hospitals now making up 4.3% of salaries and benefits, a decrease of 190bps. Expansion in this area is concentrated on internal infrastructure improvements and higher acuity service offerings, which often have higher margins. EBITDA margins in this segment are 10%, which is above average for hospitals.
| THC 1H23 Hospital Results | ||
| Ratio (As a percentage of total revenue) | Year over Year Change in Revenue Compared to 1H22 | |
| Medicare | 16.9% | 1.2% |
| Medicaid | 7.6% | 5.2% |
| Private Insuror (includes Medicare Advantage) | 70.6% | 6.9% |
| Other | 5.0% | -10.8% |
THC does not currently pay a dividend but has a share repurchase program with $660 million in authorization remaining, repurchasing 7% of outstanding shares in 2Q23. Debt repayment remains a priority, with the 2Q23 leverage ratio being 4.14x debt to EBITDA and an average interest rate of 5.6%.
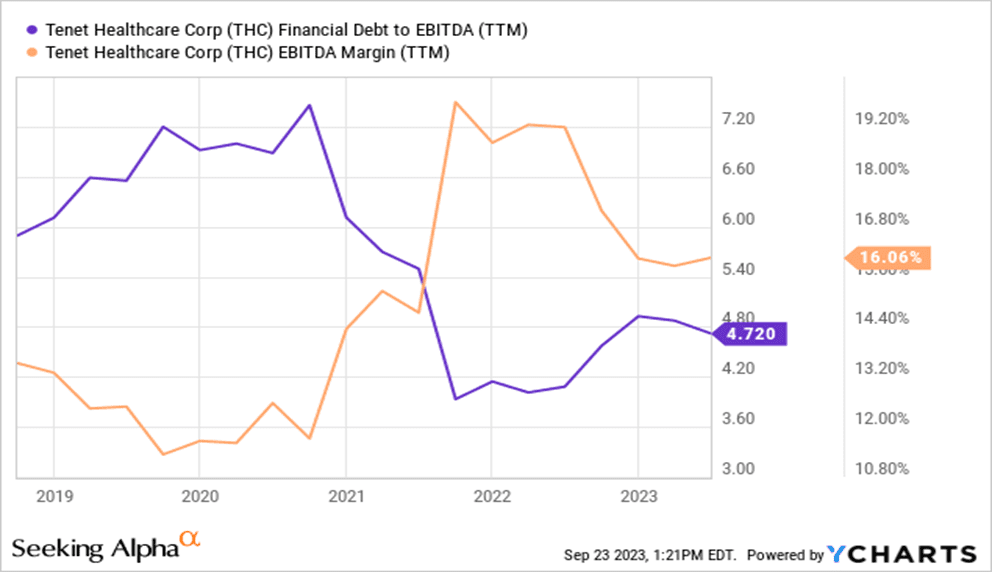
FY23 is expected to be a recovery in cash flows and EBITDA despite remaining COVID-19 and inflation headwinds. THC is expected to generate $1.2 billion in FCF for FY23, a return to its pre-pandemic form. The commitment to expanding core competencies through the profitable USPI-run ambulatory care segment makes the long-term prospects attractive.
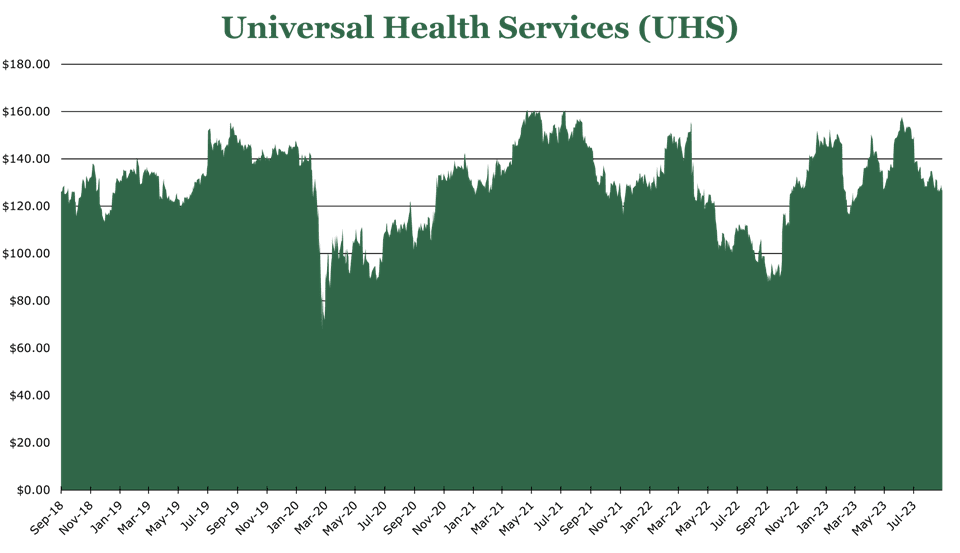
Universal Health Services (UHS) – Tailwinds in Mental Healthcare Demand
UHS operates mental and acute health services in the United States and the United Kingdom. Across 400 facilities, it had 3.4 million patient interactions. UHS is a leader in mental healthcare, running 341 mental healthcare facilities in the US and UK. Compared to other forms of medical care, mental healthcare tends to have more stable pricing and lower capital costs. Despite only making up 20% of topline revenue, the behavioral health segment makes up 43% of net revenue.
UHS is benefitting significantly from the increased need for mental healthcare. Demand for mental healthcare services has outpaced supply, with the World Health Organization estimating that there has been a 13-25% increase in mental health conditions and substance abuse since before the pandemic. UHS estimates the total addressable market for clinical mental healthcare services is $50 billion.
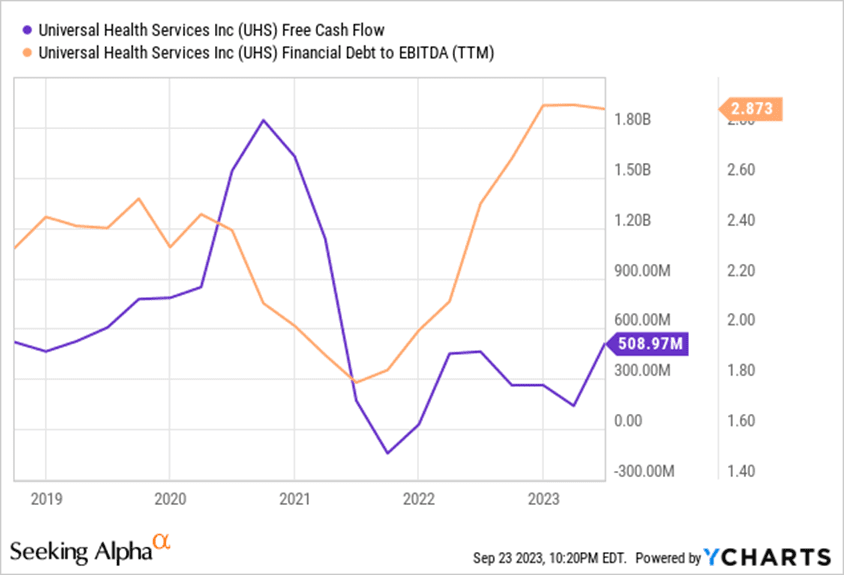
UHS has 3 under construction facilities in the acute care segment, adding 436 beds by FY25. In the behavioral health segment, a 96-bed JV with Trinity Health is expected to open in FY24. Historically, capital allocation is split equally between Acquisition and organic growth investments, with opportunistic share repurchases. Since FY19, UHS has reacquired 20% of outstanding shares. UHS pays a 0.63% yield. Current debt to EBITDA is 2.9x, a large increase year over year due to a ramp-up in capex spending.
During 2Q23, overall revenue growth was 9.7%. On a granular level, behavioral health revenues increased on average by 6.2% year over year on a per-patient basis, with acute health revenue increasing 2% year over year on a per-patient basis. UHS is seeing a significant amount of pent-up demand release with 8% same-facility admission growth year over year. UHS has secular tailwinds from an aging population and the increased need for mental healthcare services.
| UHS 1H23 Results (Ex UK, Ex non-patient revenue) | ||
| Ratio (As a percentage of total revenue) | Year over Year Change in Revenue Compared to 1H22 | |
| Medicare | 13.4% | -0.3% |
| Medicare Advantage | 14.0% | 9.8% |
| Medicaid | 11.0% | -4.7% |
| Managed Medicaid | 19.1% | 12.4% |
| Private Insurer | 35.1% | 6.3% |
| Other | 7.5% | 9.7% |