Economic and Market Review
August 30, 2023
Overview
Congress is spending the bulk of September deliberating over the Federal Budget for fiscal year 2024 as a looming deadline on September 30th approaches. Should an agreement not be reached, then a government shutdown could occur. The $6.9 trillion proposed budget encompasses 438 agencies as well as 15 executive branches of the Federal Government.
The most recent Federal Government shutdown lasted 35 days, from December 22, 2018, until January 25, 2019, making it the longest government shutdown in history. Partial government shutdowns have also occurred in the past, shuttering selected federal agencies and programs.
Federal Reserve data is revealing an erosion in consumer credit quality, with a particular increase in retail store credit card delinquencies. Credit card usage has accounted for roughly 20% of consumer spending growth over the past year.
The rate on a 30-year fixed conforming mortgage fell to 7.18% in August, after reaching a 23-year high of 7.23%. The resilience of the housing market has become questionable by many analysts and economists, as elevated home prices continue to make purchases unaffordable for millions of Americans. The cost of apartment and residential rentals are starting to decrease in various areas of the country, as an additional inventory of rentals has been coming onto the market.
Equities retracted in August as contentious earnings estimates and lingering inflation risks held stocks back from advancing. Supply constraints that existed a year ago have essentially vanished, yet have led many companies to explore new sourcing locations and facilities. China, the world’s largest exporting country, is showing signs of a possible economic contraction, seen by analysts as a potential hindrance to global expansion.
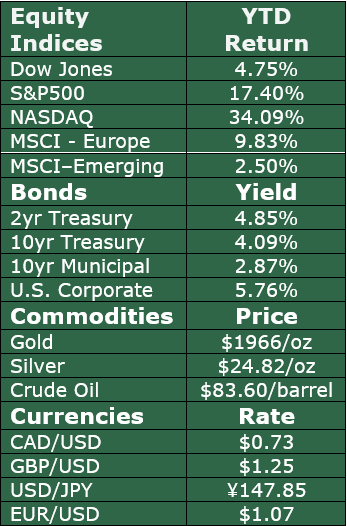
Petroleum production cuts by OPEC and other oil-producing countries propelled oil and gasoline prices higher in August. Other factors affecting oil prices as fall approaches include seasonality, demand, and supply constraints. Oil ended August at $83.60 per barrel, yet still lower than the recent highs of over $120 per barrel in June 2022.
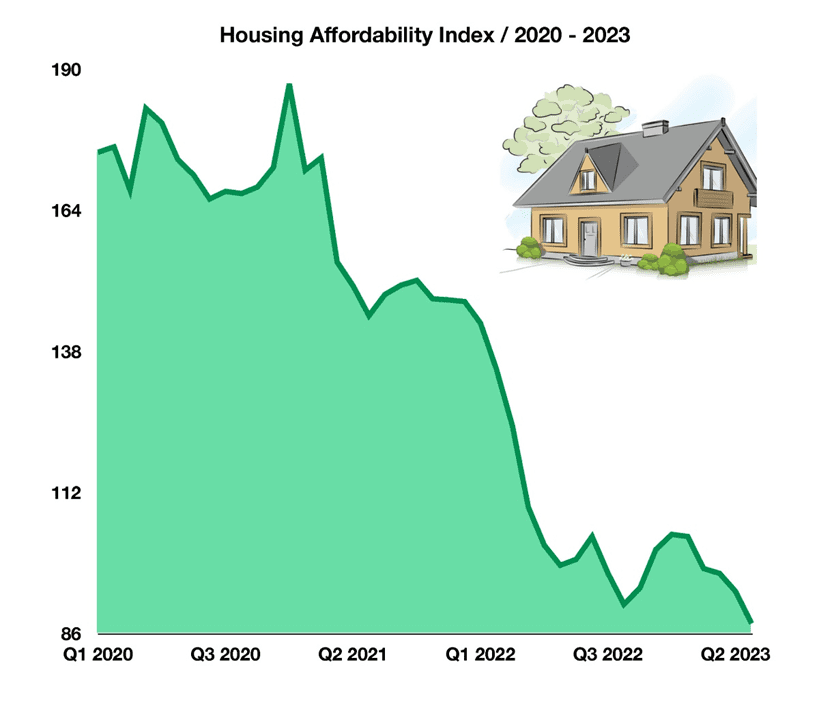
Housing Market is Near the Least Affordable In US History
Measured by the Housing Affordability Index, the affordability of homes has been steadily eroding since early 2021. Factors affecting affordability include home prices, mortgage rates, and household incomes. With historic inflation outpacing income growth, home buyers in the U.S. have been unable to keep up with rising prices and mortgage rates.
When the Fed increases interest rates to combat inflation, mortgage rates are similarly affected. The average 30-year mortgage rate rose to a high of 7.24%, the highest since 2001. This is a significant difference to the lows reached in 2021 when the average 30-year mortgage fell to 2.65% mortgages, the lowest in U.S. history. This creates a less affordable environment for home buyers and harms potential buyers’ abilities to acquire property.
First-time buyers are forced to either buy a home knowing they may not be able to afford it or continue renting until affordability rises. For those who already own a home, remaining in their current house instead of buying a new one has been increasing in popularity as well.
New mortgage rules are attempting to make homes more accessible to homebuyers with low credit scores by lowering the fees for low-credit buyers while, in some cases, raising the fees for high-credit buyers. This new fee restructuring revolves around what Fannie Mae calls “loan level price adjustment costs” and what Freddie Mac refers to as “credit fees.”
Having become effective on May 1, these two agencies increased their risk-based fees, which are intended to protect the agencies from borrowers deemed as more likely to default on their payments. However, in an attempt to make homes more affordable for individuals without large savings, their adjustments instead lowered fees for purchasers with smaller down payments. On a conventional mortgage, borrowers who now put down payments between 5% and 25%, which are considered larger down payments, will pay more in fees than those who put down less than 5% of the home’s value. Thus, the higher fees are impacting those who are considered less risky.
While purchasers with high credit scores will still be charged lower fees than purchasers with low credit scores, the disparity between fees will be reduced. This is intended to offset the risks of supporting purchasers with riskier credit, whom Fannie Mae claims may not have large savings or help from family or friends like their peers with higher credit scores.
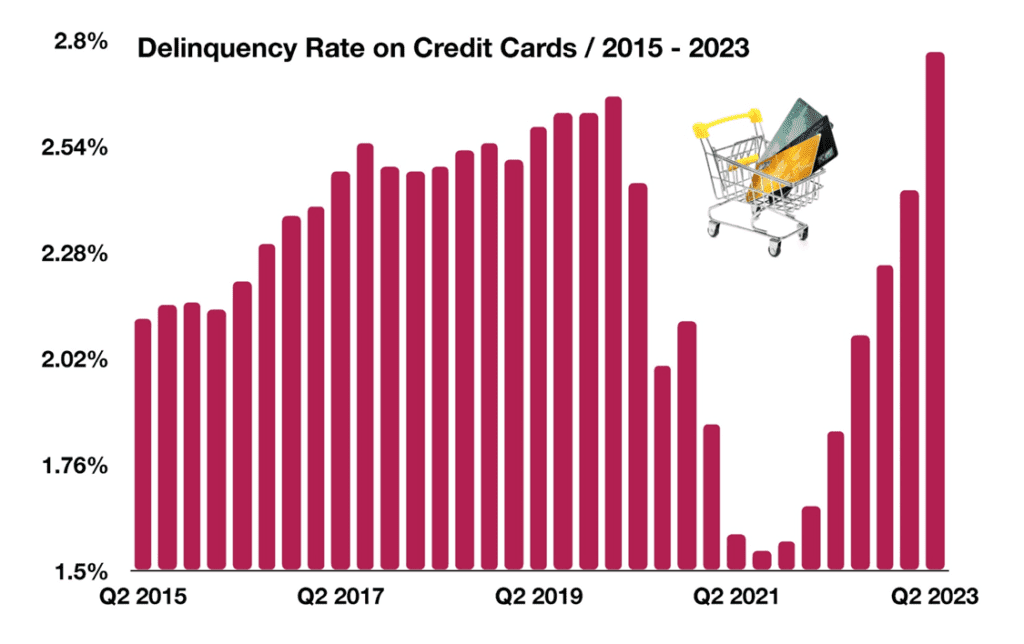
Consumer Loan Delinquency on the Rise
A survey released by the Federal Reserve Bank of Dallas found that overall credit and lending activity is deteriorating nationwide. The survey encompasses loan activity among larger banks, regional banks, finance companies, and various lenders.
The primary concern of this report centers around rising delinquency rates on credit cards, which indicates ongoing trends pertaining to consumer behavior. Consumers have become more accustomed to taking on debt, which declined during the pandemic. However, consumers are now financing an increasingly high level of purchases, which has also driven up rates of delinquency.
This is of particular interest to economists, who view this dynamic as a worrying sign for consumer spending. In 2023, credit card delinquency rates reached their highest level in over a decade, surpassing levels last seen in late 2012. When consumers increasingly take on debt which they are unable to pay back, it creates a delinquency cycle that poses financial duress for consumers. Delinquency rates fell substantially in 2021 as pandemic assistance funds helped alleviate the debt burden of millions of credit card holders, yet catapulted back up once those funds were exhausted.
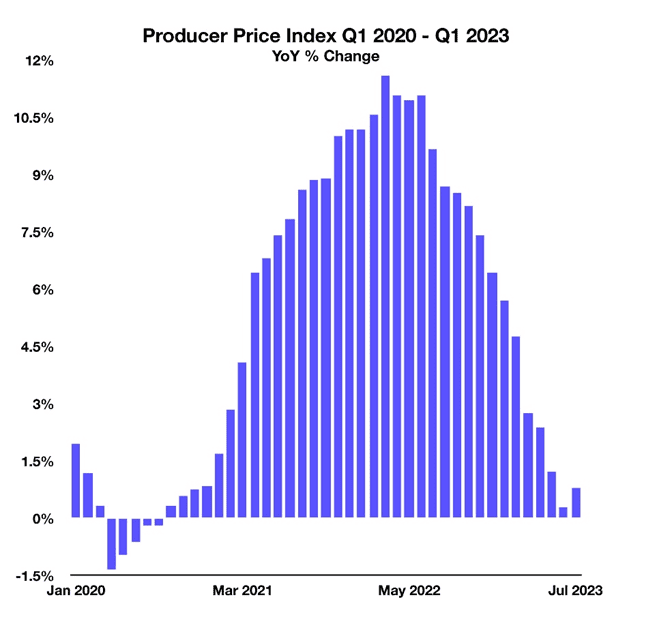
Producer Prices Heading Lower, What it Means
The Producer Price Index (PPI) measures the selling prices domestic companies receive when purchasing everything from raw materials to products themselves. Similar to how the Consumer Price Index (CPI) tracks prices consumers pay for goods, the PPI tracks prices that corporations pay.
With the PPI steadily decreasing to its lowest growth rate since 2020, corporations are now forced to pay far less for commodities than previously. This affects companies across a wide variety of industries and is a leading indicator of what may soon trickle down to CPI. With companies paying lower prices, consumer prices have historically followed and continue their downward path as has been exemplified in recent months.
How Deflation and Inflation Affect High Income and Low Income Earners
As inflation has taken center stage over the past year, consumers among all demographics have been affected in various ways. Consumers know inflation as the overall increase in the cost of goods and services, from shoes to gasoline. However, products that are essential for everyday life can be more costly for some than others, such as food, healthcare, and toilet paper. These products usually make up a larger portion of expenses for lower-income consumers and less for higher-income earners. In essence, inflation can be much more of a challenge for lower-income earners as less disposable income is left for more desirable items.
Fortunately, consumers have the ability to control what they buy when inflation sets in, such as buying hamburgers instead of steak. This is where consumer choice is critical as to where the economy is heading and what companies might benefit more than others.
As the economy slows and lower prices eventually settle in, a deflationary environment evolves pulling certain asset prices down. Historically, lower asset prices affect higher income earners with assets, rather than those with little or no assets. Deflation may affect the prices of assets such as homes, cars, stocks, and commodities.
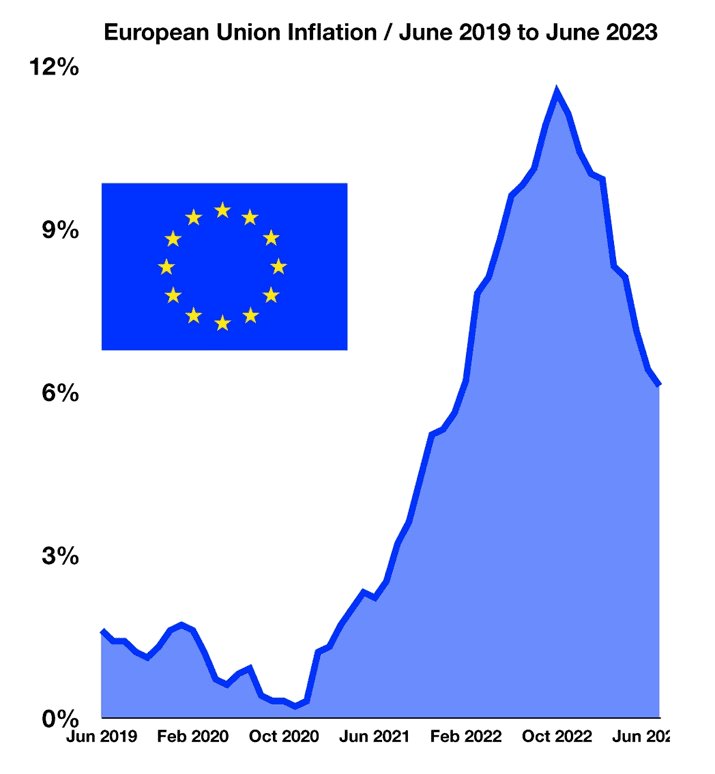
European Inflation Cools
Demand for products and services can vary from country to country as consumers have different choices on what they purchase. Supply constraints, transportation costs, and currency exchange rates can also affect prices among various countries and regions.
The European Union includes 27 member countries with over 448 million residents encompassing numerous cultures and languages. Similar to the United States, Europe has been experiencing an inflationary environment since 2022, propelled by supply constraints, high service costs, high energy prices, and post-pandemic demand. Inflation in the EU reached 11.5% in October 2022, surpassing the 7.7% rate in the U.S. for the same period. The most recent data available shows that the EU inflation rate had dropped to 6.1% in July 2023, down from 6.4% in June 2023.
Particular countries still have inflation rates above that of the EU, including Hungary at 19.9%, Poland at 11%, and Slovakia at 11.3%. Continued supply issues affecting energy products resulting from the war have resulted in persistent inflation for certain regions.